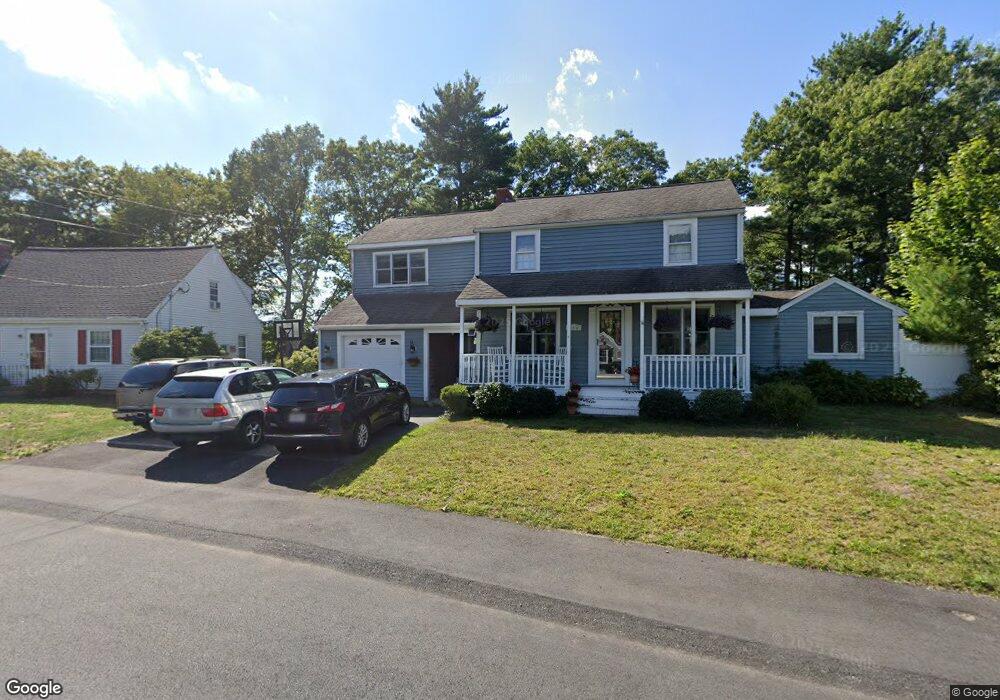
51 Belmont St Weymouth, MA 02188
South Weymouth NeighborhoodEstimated Value: $696,982 - $755,000
4
Beds
2
Baths
1,737
Sq Ft
$418/Sq Ft
Est. Value
About This Home
This home is located at 51 Belmont St, Weymouth, MA 02188 and is currently estimated at $726,246, approximately $418 per square foot. 51 Belmont St is a home located in Norfolk County with nearby schools including Frederick C Murphy, Abigail Adams Middle School, and Weymouth Middle School Chapman.
Ownership History
Date
Name
Owned For
Owner Type
Purchase Details
Closed on
Nov 24, 1987
Sold by
Skerpan William
Bought by
Christo Brian T
Current Estimated Value
Home Financials for this Owner
Home Financials are based on the most recent Mortgage that was taken out on this home.
Original Mortgage
$144,900
Interest Rate
11.22%
Mortgage Type
Purchase Money Mortgage
Create a Home Valuation Report for This Property
The Home Valuation Report is an in-depth analysis detailing your home's value as well as a comparison with similar homes in the area
Home Values in the Area
Average Home Value in this Area
Purchase History
| Date | Buyer | Sale Price | Title Company |
|---|---|---|---|
| Christo Brian T | $161,000 | -- |
Source: Public Records
Mortgage History
| Date | Status | Borrower | Loan Amount |
|---|---|---|---|
| Open | Christo Brian T | $248,800 | |
| Closed | Christo Brian T | $184,000 | |
| Closed | Christo Brian T | $144,900 |
Source: Public Records
Tax History Compared to Growth
Tax History
| Year | Tax Paid | Tax Assessment Tax Assessment Total Assessment is a certain percentage of the fair market value that is determined by local assessors to be the total taxable value of land and additions on the property. | Land | Improvement |
|---|---|---|---|---|
| 2025 | $6,506 | $644,200 | $243,500 | $400,700 |
| 2024 | $6,238 | $607,400 | $232,000 | $375,400 |
| 2023 | $5,732 | $548,500 | $214,800 | $333,700 |
| 2022 | $5,500 | $479,900 | $182,300 | $297,600 |
| 2021 | $5,323 | $453,400 | $182,300 | $271,100 |
| 2020 | $5,054 | $424,000 | $182,300 | $241,700 |
| 2019 | $4,970 | $410,100 | $175,300 | $234,800 |
| 2018 | $4,846 | $387,700 | $166,900 | $220,800 |
| 2017 | $4,740 | $370,000 | $159,000 | $211,000 |
| 2016 | $4,591 | $358,700 | $152,900 | $205,800 |
| 2015 | $4,301 | $333,400 | $146,000 | $187,400 |
| 2014 | $4,150 | $312,000 | $135,800 | $176,200 |
Source: Public Records
Map
Nearby Homes
- 116 Belmont St
- 501 Commerce Dr Unit 2310
- 501 Commerce Dr Unit 1111
- 501 Commerce Dr Unit 4206
- 501 Commerce Dr Unit 4308
- 501 Commerce Dr Unit 4306
- 655 Summer St
- 255 West St
- 262 West St
- 200 Justin Dr Unit 3
- 92 Mercury St
- 432 Grove St
- 441 Grove St
- 972 Liberty St
- 308 Forest St
- 48 Apple Tree Ln
- 67 Abby Rd
- 16 Jay Rd
- 2 Tara Dr Unit 1
- 54 Federal St