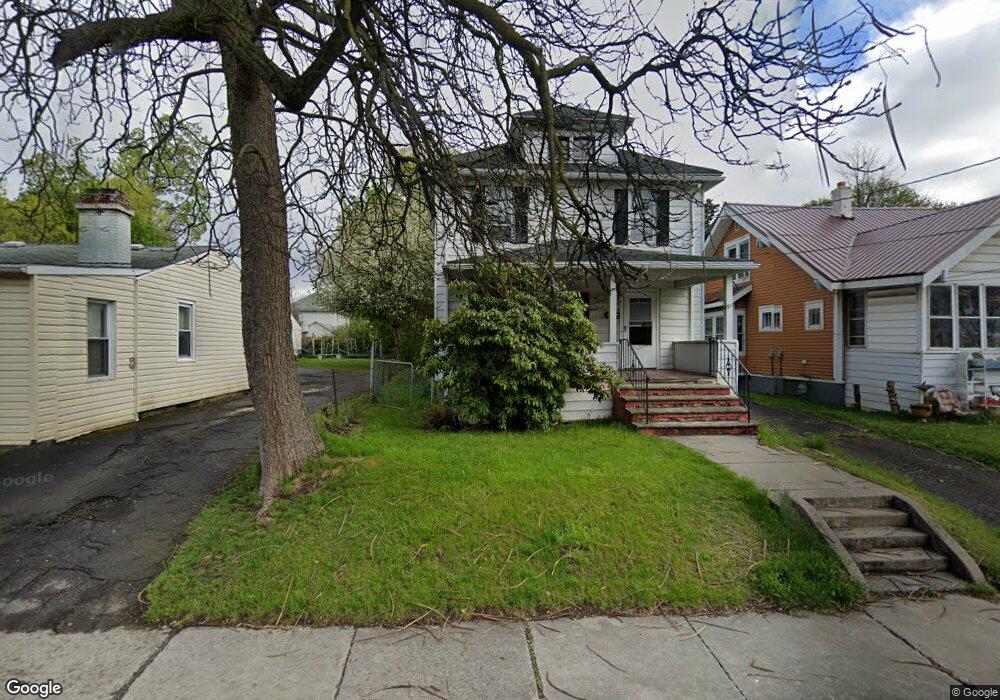
51 Bevier St Binghamton, NY 13901
Northside Binghamton NeighborhoodEstimated Value: $118,000 - $144,954
3
Beds
1
Bath
1,450
Sq Ft
$94/Sq Ft
Est. Value
About This Home
This home is located at 51 Bevier St, Binghamton, NY 13901 and is currently estimated at $135,739, approximately $93 per square foot. 51 Bevier St is a home located in Broome County with nearby schools including Theodore Roosevelt Elementary School, Binghamton High School, and East Middle School.
Ownership History
Date
Name
Owned For
Owner Type
Purchase Details
Closed on
May 4, 2022
Sold by
County Of Broome
Bought by
Lynch Grafton I
Current Estimated Value
Purchase Details
Closed on
Jun 17, 2011
Sold by
Zelentz Annette and Zelenetz Annette
Bought by
Leveille Lee
Home Financials for this Owner
Home Financials are based on the most recent Mortgage that was taken out on this home.
Original Mortgage
$42,550
Interest Rate
4.58%
Mortgage Type
Seller Take Back
Purchase Details
Closed on
Jul 16, 2010
Sold by
Oshea Michelle and Alston Derek M
Bought by
Zelentz Annette and Zelenetz Annette
Purchase Details
Closed on
Dec 15, 2005
Sold by
Getman
Bought by
Oshea Michelle
Home Financials for this Owner
Home Financials are based on the most recent Mortgage that was taken out on this home.
Original Mortgage
$51,000
Interest Rate
6.34%
Mortgage Type
Future Advance Clause Open End Mortgage
Create a Home Valuation Report for This Property
The Home Valuation Report is an in-depth analysis detailing your home's value as well as a comparison with similar homes in the area
Home Values in the Area
Average Home Value in this Area
Purchase History
| Date | Buyer | Sale Price | Title Company |
|---|---|---|---|
| Lynch Grafton I | $53,500 | None Available | |
| Leveille Lee | $46,906 | None Available | |
| Zelentz Annette | -- | None Available | |
| Oshea Michelle | $51,000 | Frederick Xlander |
Source: Public Records
Mortgage History
| Date | Status | Borrower | Loan Amount |
|---|---|---|---|
| Previous Owner | Leveille Lee | $42,550 | |
| Previous Owner | Oshea Michelle | $51,000 |
Source: Public Records
Tax History
| Year | Tax Paid | Tax Assessment Tax Assessment Total Assessment is a certain percentage of the fair market value that is determined by local assessors to be the total taxable value of land and additions on the property. | Land | Improvement |
|---|---|---|---|---|
| 2024 | $5,815 | $59,000 | $8,200 | $50,800 |
| 2023 | $5,709 | $59,000 | $8,200 | $50,800 |
| 2022 | $5,574 | $59,000 | $8,200 | $50,800 |
| 2021 | $5,512 | $59,000 | $8,200 | $50,800 |
| 2020 | $3,865 | $59,000 | $8,200 | $50,800 |
| 2019 | $1,860 | $59,000 | $8,200 | $50,800 |
| 2018 | $2,883 | $59,000 | $8,200 | $50,800 |
| 2017 | $2,914 | $59,000 | $8,200 | $50,800 |
| 2016 | $2,942 | $59,000 | $8,200 | $50,800 |
| 2015 | $2,614 | $59,000 | $8,200 | $50,800 |
| 2014 | $2,614 | $59,000 | $8,200 | $50,800 |
Source: Public Records
Map
Nearby Homes
Your Personal Tour Guide
Ask me questions while you tour the home.