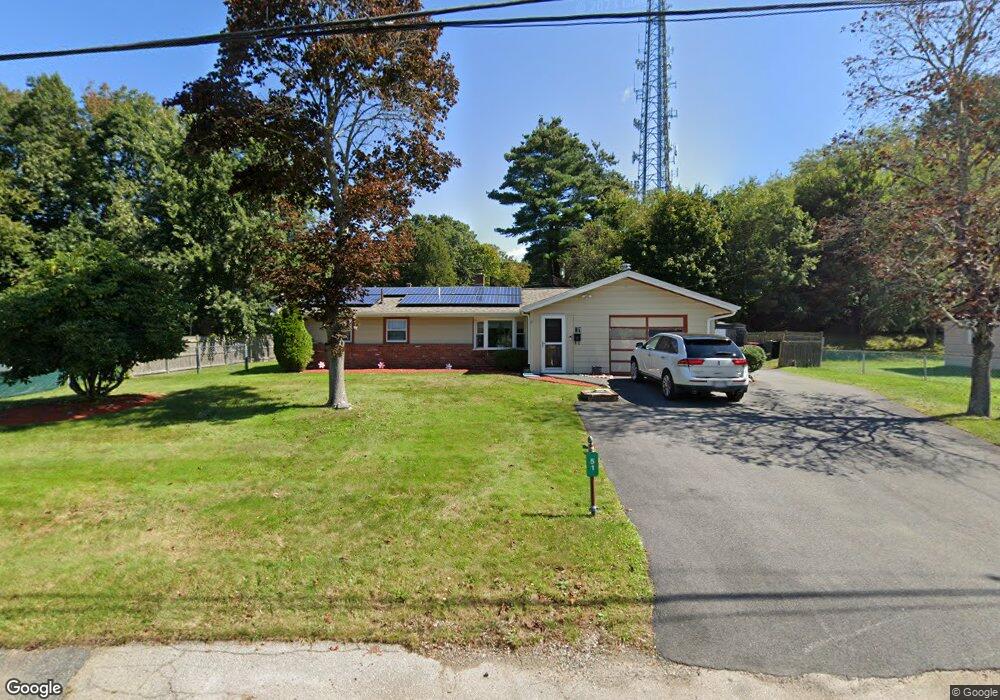
51 Boundary Cir Brockton, MA 02302
Montello NeighborhoodEstimated Value: $481,000 - $560,000
3
Beds
1
Bath
1,200
Sq Ft
$421/Sq Ft
Est. Value
About This Home
This home is located at 51 Boundary Cir, Brockton, MA 02302 and is currently estimated at $504,890, approximately $420 per square foot. 51 Boundary Cir is a home located in Plymouth County with nearby schools including Brookfield Elementary School, Downey Elementary School, and Ashfield Middle School.
Ownership History
Date
Name
Owned For
Owner Type
Purchase Details
Closed on
Jun 18, 2021
Sold by
Gilmore Gloria D
Bought by
Harris Gloria D
Current Estimated Value
Home Financials for this Owner
Home Financials are based on the most recent Mortgage that was taken out on this home.
Original Mortgage
$183,500
Outstanding Balance
$165,411
Interest Rate
2.9%
Mortgage Type
New Conventional
Estimated Equity
$339,479
Purchase Details
Closed on
Mar 13, 2017
Sold by
Harris-Gilmore Gloria D
Bought by
Gilmore John and Gilmore Gloria D
Purchase Details
Closed on
Apr 8, 2004
Sold by
Rice John A and Rice Joan L
Bought by
Harris-Gilmore Gloria D
Create a Home Valuation Report for This Property
The Home Valuation Report is an in-depth analysis detailing your home's value as well as a comparison with similar homes in the area
Home Values in the Area
Average Home Value in this Area
Purchase History
| Date | Buyer | Sale Price | Title Company |
|---|---|---|---|
| Harris Gloria D | -- | None Available | |
| Harris Gloria D | -- | None Available | |
| Gilmore John | -- | -- | |
| Harris-Gilmore Gloria D | $240,000 | -- | |
| Gilmore John | -- | -- | |
| Harris-Gilmore Gloria D | $240,000 | -- |
Source: Public Records
Mortgage History
| Date | Status | Borrower | Loan Amount |
|---|---|---|---|
| Open | Harris Gloria D | $183,500 | |
| Closed | Harris Gloria D | $183,500 | |
| Previous Owner | Harris-Gilmore Gloria D | $25,000 |
Source: Public Records
Tax History Compared to Growth
Tax History
| Year | Tax Paid | Tax Assessment Tax Assessment Total Assessment is a certain percentage of the fair market value that is determined by local assessors to be the total taxable value of land and additions on the property. | Land | Improvement |
|---|---|---|---|---|
| 2025 | $4,966 | $410,100 | $160,300 | $249,800 |
| 2024 | $4,695 | $390,600 | $160,300 | $230,300 |
| 2023 | $4,769 | $367,400 | $110,600 | $256,800 |
| 2022 | $4,476 | $320,400 | $100,500 | $219,900 |
| 2021 | $4,104 | $283,000 | $93,300 | $189,700 |
| 2020 | $3,963 | $261,600 | $81,900 | $179,700 |
| 2019 | $3,754 | $241,600 | $78,200 | $163,400 |
| 2018 | $2,844 | $220,600 | $78,200 | $142,400 |
| 2017 | $3,178 | $197,400 | $78,200 | $119,200 |
| 2016 | $3,290 | $189,500 | $74,500 | $115,000 |
| 2015 | $2,944 | $162,200 | $74,500 | $87,700 |
| 2014 | $2,890 | $159,400 | $74,500 | $84,900 |
Source: Public Records
Map
Nearby Homes
- 5 Brookville Ave
- 261 Jon Dr
- 38 Stephen Dr
- 18 Brookfield Dr
- 719 S Franklin St Unit L Block 1
- 719 S Franklin St Unit D Block 1
- 719 S Franklin St Unit C Block 1
- 690 N Quincy St
- 29 Belair Dr
- 170 Elsie Rd
- 285 Hovendon Ave
- 12 Hamilton Way
- 505 Hampton Way Unit 505
- 40 Christopher Rd
- 53 Kent St
- 61 Kent St
- 55 Border Rd
- 28 Border Rd
- 60 Bonney St
- 13 Mayflower Rd
- 59 Boundary Cir
- 43 Boundary Cir
- 926 N Quincy St
- 916 N Quincy St
- 56 Boundary Cir
- 46 Boundary Cir
- 934 N Quincy St
- 67 Boundary Cir
- 35 Boundary Cir
- 908 N Quincy St
- 64 Boundary Cir
- 17 Braintree Ave
- 25 Braintree Ave
- 942 N Quincy St
- 515 N Quincy St
- 495 N Quincy St
- 35 Braintree Ave
- 27 Boundary Cir
- 74 Boundary Cir
- 900 N Quincy St