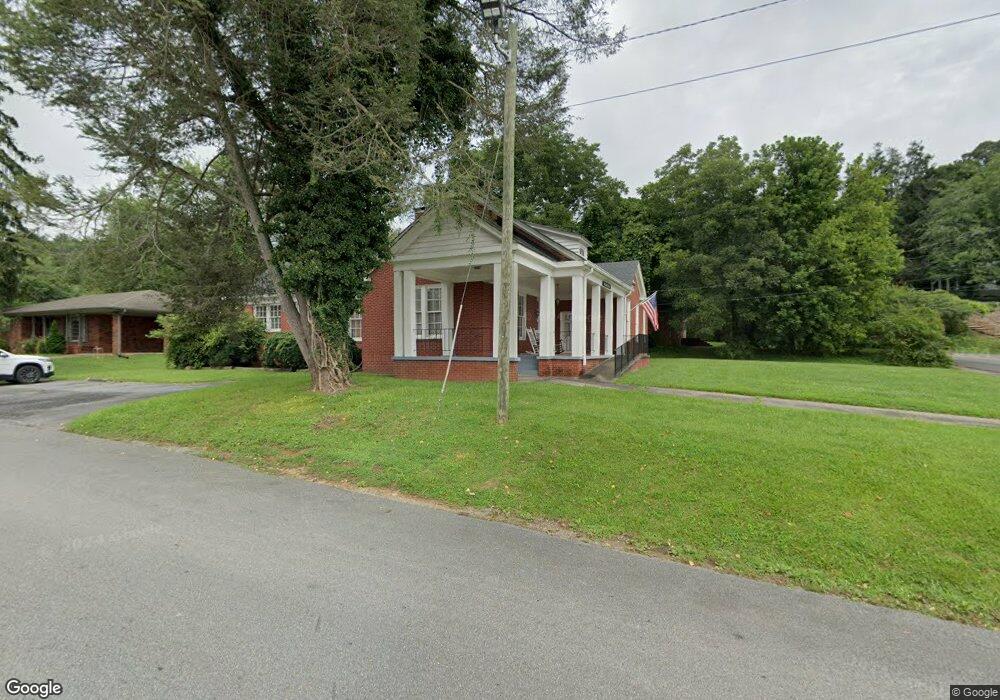
51 Broad St Ellijay, GA 30540
Estimated Value: $501,326
--
Bed
3
Baths
3,024
Sq Ft
$166/Sq Ft
Est. Value
About This Home
This home is located at 51 Broad St, Ellijay, GA 30540 and is currently estimated at $501,326, approximately $165 per square foot. 51 Broad St is a home located in Gilmer County with nearby schools including Ellijay Elementary School, Clear Creek Elementary School, and Gilmer Middle School.
Ownership History
Date
Name
Owned For
Owner Type
Purchase Details
Closed on
May 14, 2015
Sold by
Gronholm Terry A
Bought by
Tigerco Investment Corp
Current Estimated Value
Purchase Details
Closed on
Feb 13, 2013
Sold by
Harold Anne Gronholm F
Bought by
Gronholm Terry A and Harold Anne Gronholm F
Purchase Details
Closed on
Feb 12, 2013
Sold by
Gronholm Harold August
Bought by
Harold Anne Gronholm T
Purchase Details
Closed on
May 10, 2010
Sold by
Gronholm Harold A/Estate Of A
Bought by
Gronholm Harold A
Purchase Details
Closed on
Mar 14, 2005
Sold by
United Community Bank
Bought by
Ray Robert M
Purchase Details
Closed on
Mar 10, 2005
Sold by
Ray Robert M
Bought by
Gronholm Harold A and Gronholm Anne
Purchase Details
Closed on
Dec 1, 1997
Bought by
Ray Robert M
Purchase Details
Closed on
Dec 1, 1993
Bought by
Ray Robert M
Create a Home Valuation Report for This Property
The Home Valuation Report is an in-depth analysis detailing your home's value as well as a comparison with similar homes in the area
Home Values in the Area
Average Home Value in this Area
Purchase History
| Date | Buyer | Sale Price | Title Company |
|---|---|---|---|
| Tigerco Investment Corp | $215,000 | -- | |
| Gronholm Terry A | -- | -- | |
| Harold Anne Gronholm T | -- | -- | |
| Gronholm Harold A | $395,000 | -- | |
| Ray Robert M | -- | -- | |
| Gronholm Harold A | $390,000 | -- | |
| Ray Robert M | $115,000 | -- | |
| Ray Robert M | -- | -- |
Source: Public Records
Tax History Compared to Growth
Tax History
| Year | Tax Paid | Tax Assessment Tax Assessment Total Assessment is a certain percentage of the fair market value that is determined by local assessors to be the total taxable value of land and additions on the property. | Land | Improvement |
|---|---|---|---|---|
| 2024 | $3,443 | $198,040 | $110,880 | $87,160 |
| 2023 | $2,185 | $120,200 | $45,200 | $75,000 |
| 2022 | $2,087 | $139,480 | $40,200 | $99,280 |
| 2021 | $2,299 | $136,280 | $40,200 | $96,080 |
| 2020 | $2,222 | $101,000 | $40,200 | $60,800 |
| 2019 | $2,287 | $101,000 | $40,200 | $60,800 |
| 2018 | $2,253 | $98,200 | $40,200 | $58,000 |
| 2017 | $2,112 | $85,840 | $40,200 | $45,640 |
| 2016 | $2,159 | $87,560 | $40,200 | $47,360 |
| 2015 | $2,193 | $88,960 | $44,840 | $44,120 |
| 2014 | $2,644 | $103,200 | $44,840 | $58,360 |
| 2013 | -- | $105,120 | $44,840 | $60,280 |
Source: Public Records
Map
Nearby Homes
- 14551 Highway 52
- 0 Georgia 52
- LT 43&44 Reece Mountain Rd
- 00 Highgrove Dr
- N/A Willard Mountain Rd
- 163 Jasmine Ct
- Lot 95 Cedar St
- Lot 95 Cedar St Unit 95
- LT 104 River Knoll Trail
- 165 Corbin Hill Rd
- 66 Logan Ln
- 84 Logan St
- Ga-382
- 6 Logan Way
- 0 Walhalla Ct Unit 388 10559982
- 0 Walhalla Ct Unit 7491828
- 0 Walhalla Ct Unit 7611949
- 0 Walhalla Ct Unit 10419854
- 0 Walhalla Ct Unit 7491796
- 0 Walhalla Ct Unit Lot 387 8994062