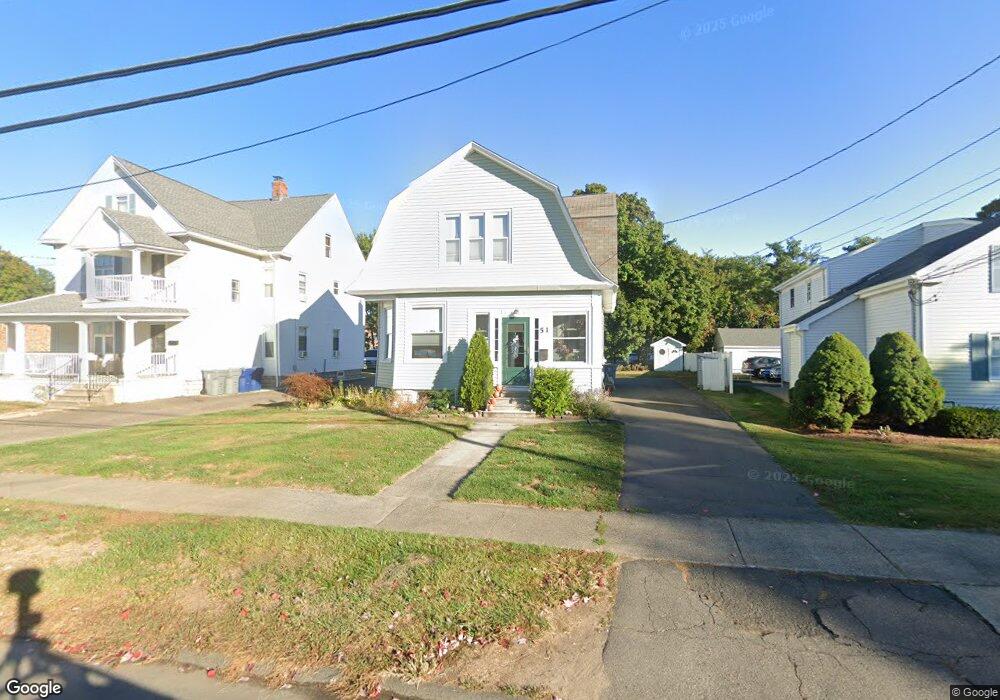
51 Broad St Plainville, CT 06062
Estimated Value: $326,000 - $364,000
3
Beds
2
Baths
1,718
Sq Ft
$200/Sq Ft
Est. Value
About This Home
This home is located at 51 Broad St, Plainville, CT 06062 and is currently estimated at $344,116, approximately $200 per square foot. 51 Broad St is a home located in Hartford County with nearby schools including Middle School Of Plainville, Plainville High School, and Great Beginnings.
Ownership History
Date
Name
Owned For
Owner Type
Purchase Details
Closed on
Jan 25, 2017
Sold by
Department Of Housing & Urban Dev
Bought by
Martino Lorraine L
Current Estimated Value
Purchase Details
Closed on
Sep 9, 2016
Sold by
Chfa
Bought by
Department Of Housing & Urban Dev
Purchase Details
Closed on
Aug 3, 2016
Sold by
Santana Edwin and Chfa
Bought by
Chfa
Purchase Details
Closed on
Nov 6, 2006
Sold by
Raia Lenny J
Bought by
Santana Edwin
Purchase Details
Closed on
Jan 21, 1994
Sold by
Fillion Robert
Bought by
Reyna Antonio
Purchase Details
Closed on
Sep 26, 1989
Sold by
First Baptist Churc
Bought by
Reyna Antonio
Create a Home Valuation Report for This Property
The Home Valuation Report is an in-depth analysis detailing your home's value as well as a comparison with similar homes in the area
Home Values in the Area
Average Home Value in this Area
Purchase History
| Date | Buyer | Sale Price | Title Company |
|---|---|---|---|
| Martino Lorraine L | $131,000 | -- | |
| Martino Lorraine L | $131,000 | -- | |
| Department Of Housing & Urban Dev | -- | -- | |
| Department Of Housing & Urban Dev | -- | -- | |
| Chfa | $196,260 | -- | |
| Chfa | $196,260 | -- | |
| Santana Edwin | $200,000 | -- | |
| Santana Edwin | $200,000 | -- | |
| Reyna Antonio | $15,000 | -- | |
| Reyna Antonio | $15,000 | -- | |
| Reyna Antonio | $166,000 | -- |
Source: Public Records
Mortgage History
| Date | Status | Borrower | Loan Amount |
|---|---|---|---|
| Open | Reyna Antonio | $104,000 | |
| Previous Owner | Reyna Antonio | $6,304 |
Source: Public Records
Tax History
| Year | Tax Paid | Tax Assessment Tax Assessment Total Assessment is a certain percentage of the fair market value that is determined by local assessors to be the total taxable value of land and additions on the property. | Land | Improvement |
|---|---|---|---|---|
| 2025 | $5,005 | $145,670 | $54,110 | $91,560 |
| 2024 | $4,755 | $145,670 | $54,110 | $91,560 |
| 2023 | $4,577 | $145,670 | $54,110 | $91,560 |
| 2022 | $4,463 | $145,670 | $54,110 | $91,560 |
| 2021 | $4,178 | $120,890 | $47,040 | $73,850 |
| 2020 | $4,185 | $120,890 | $47,040 | $73,850 |
| 2019 | $4,185 | $120,890 | $47,040 | $73,850 |
| 2018 | $4,091 | $120,890 | $47,040 | $73,850 |
| 2017 | $3,951 | $120,890 | $47,040 | $73,850 |
| 2016 | $4,089 | $127,820 | $42,630 | $85,190 |
| 2015 | $4,069 | $127,820 | $42,630 | $85,190 |
| 2014 | $4,000 | $127,470 | $43,400 | $84,070 |
Source: Public Records
Map
Nearby Homes
- 50 Pierce St Unit 24
- 19 Maple St
- 270 East St
- 270R East St
- 248 Woodford Ave Unit 9
- 180 S Washington St Unit 7
- 12 Rockwell Ave
- 67 Shuttlemeadow Rd
- 50 Forestville Ave
- 12 Oakland St
- 85 Forest St
- 29 Skyline Dr
- 29 Mountain View Dr
- 26 Skyline Dr
- 0 Oakwood Cir
- 36 View St
- 25 Zack Ln
- 71 White Oak Ave Unit B6
- 158 E Main St
- 135 E Main St
- 53 Broad St
- 44 Broad St
- 80 Whiting St
- 72 Whiting St Unit 11
- 72 Whiting St Unit 4
- 72 Whiting St Unit 10
- 72 Whiting St Unit 5
- 72 Whiting St Unit 3
- 72 Whiting St Unit 9
- 72 Whiting St Unit 8
- 72 Whiting St Unit 7
- 72 Whiting St
- 78 Whiting St
- 19 Park St
- 70 Whiting St
- 70 Whiting St Unit H
- 70 Whiting St Unit G
- 70 Whiting St Unit F
- 70 Whiting St Unit E
Your Personal Tour Guide
Ask me questions while you tour the home.