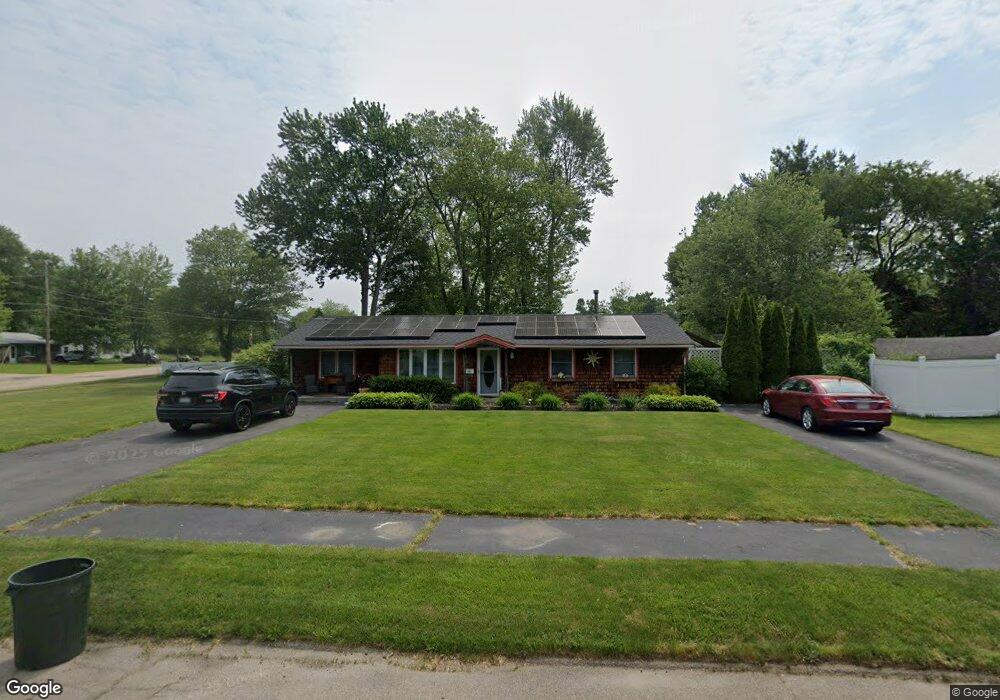
51 Burdett Rd Brockton, MA 02302
Estimated Value: $443,937 - $516,000
4
Beds
1
Bath
1,316
Sq Ft
$368/Sq Ft
Est. Value
About This Home
This home is located at 51 Burdett Rd, Brockton, MA 02302 and is currently estimated at $484,484, approximately $368 per square foot. 51 Burdett Rd is a home located in Plymouth County with nearby schools including Gilmore Elementary School, Davis K-8 School, and John F. Kennedy Elementary School.
Ownership History
Date
Name
Owned For
Owner Type
Purchase Details
Closed on
Aug 14, 2000
Sold by
Toppan Thomas W
Bought by
Geraghty Patrick and Geraghty Charlene M
Current Estimated Value
Home Financials for this Owner
Home Financials are based on the most recent Mortgage that was taken out on this home.
Original Mortgage
$30,000
Outstanding Balance
$10,917
Interest Rate
7.89%
Estimated Equity
$473,567
Create a Home Valuation Report for This Property
The Home Valuation Report is an in-depth analysis detailing your home's value as well as a comparison with similar homes in the area
Purchase History
| Date | Buyer | Sale Price | Title Company |
|---|---|---|---|
| Geraghty Patrick | $86,000 | -- |
Source: Public Records
Mortgage History
| Date | Status | Borrower | Loan Amount |
|---|---|---|---|
| Open | Geraghty Patrick | $30,000 | |
| Previous Owner | Geraghty Patrick | $40,000 |
Source: Public Records
Tax History
| Year | Tax Paid | Tax Assessment Tax Assessment Total Assessment is a certain percentage of the fair market value that is determined by local assessors to be the total taxable value of land and additions on the property. | Land | Improvement |
|---|---|---|---|---|
| 2025 | $4,752 | $392,400 | $164,300 | $228,100 |
| 2024 | $4,663 | $387,900 | $164,300 | $223,600 |
| 2023 | $4,491 | $346,000 | $114,800 | $231,200 |
| 2022 | $4,153 | $297,300 | $104,400 | $192,900 |
| 2021 | $4,202 | $289,800 | $98,200 | $191,600 |
| 2020 | $4,128 | $272,500 | $85,600 | $186,900 |
| 2019 | $3,887 | $250,100 | $82,300 | $167,800 |
| 2018 | $3,699 | $230,300 | $82,300 | $148,000 |
| 2017 | $3,106 | $192,900 | $82,300 | $110,600 |
| 2016 | $3,361 | $193,600 | $78,400 | $115,200 |
| 2015 | $2,848 | $156,900 | $78,400 | $78,500 |
| 2014 | $3,078 | $169,800 | $78,400 | $91,400 |
Source: Public Records
Map
Nearby Homes
- 12 Paulin Ave
- 15 Wachusetts Rd
- 23 Dondi Rd
- 118 Deanna Rd
- 549 Summer St
- 111 Riverview St
- 383 Summer St
- 100 Concord St
- 41 Riverview St
- 578 Plain St
- 4 Virginia Ave
- 107 N Leyden St
- 223 Clinton St Unit 16
- 231 Winter St
- 23 E Chestnut St
- 24 E Chestnut St
- 1 Thomas Cir
- 103 Clinton St
- 15 Market St
- 26 South St
Your Personal Tour Guide
Ask me questions while you tour the home.