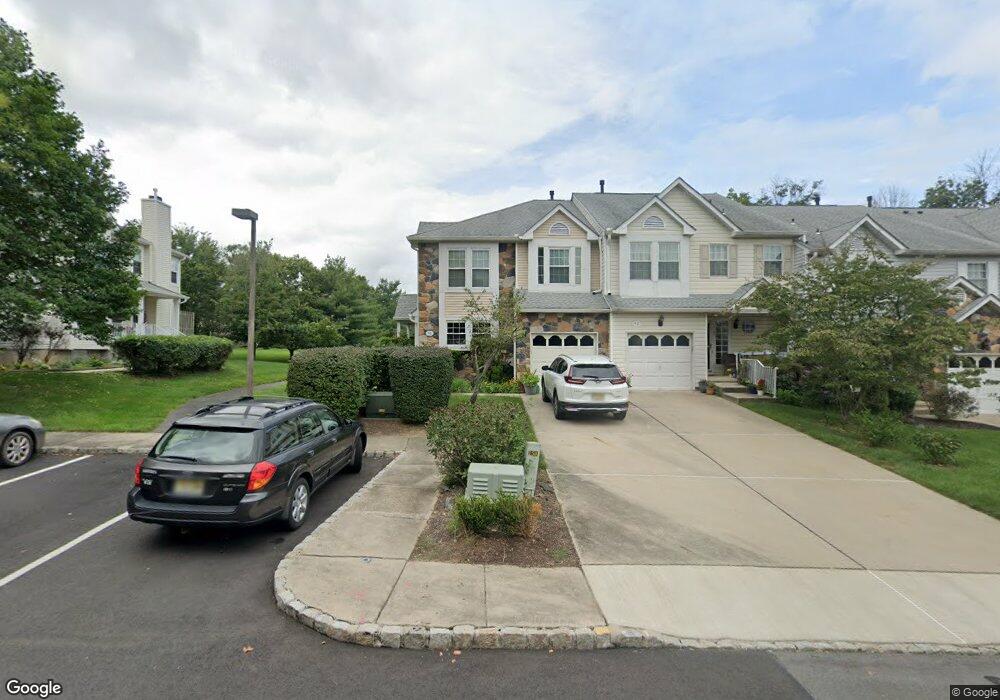
51 Castleton Rd Princeton, NJ 08540
Estimated Value: $695,222 - $726,000
--
Bed
--
Bath
1,964
Sq Ft
$360/Sq Ft
Est. Value
About This Home
This home is located at 51 Castleton Rd, Princeton, NJ 08540 and is currently estimated at $706,556, approximately $359 per square foot. 51 Castleton Rd is a home located in Somerset County with nearby schools including Orchard Hill Elementary School, Montgomery Lower Mid School, and Village Elementary School.
Ownership History
Date
Name
Owned For
Owner Type
Purchase Details
Closed on
Mar 18, 2014
Sold by
Schneider Christa and Hadass Zeev
Bought by
Schneider Christa
Current Estimated Value
Purchase Details
Closed on
Jan 18, 2000
Sold by
Verhaege Koen
Bought by
Hadass Zeev and Schneider Christa
Home Financials for this Owner
Home Financials are based on the most recent Mortgage that was taken out on this home.
Original Mortgage
$183,200
Outstanding Balance
$58,207
Interest Rate
7.84%
Estimated Equity
$648,349
Purchase Details
Closed on
Feb 28, 1997
Sold by
Pierson H Keith
Bought by
Verhaege Koen and Vercrysse Inge
Home Financials for this Owner
Home Financials are based on the most recent Mortgage that was taken out on this home.
Original Mortgage
$146,000
Interest Rate
7.77%
Purchase Details
Closed on
Mar 30, 1992
Sold by
Ryland Group
Bought by
Pierson Pierson H and Pierson Bair,Ann
Purchase Details
Closed on
May 25, 1990
Sold by
Woodbridge Construction Corp
Bought by
The Ryland Group Inc
Create a Home Valuation Report for This Property
The Home Valuation Report is an in-depth analysis detailing your home's value as well as a comparison with similar homes in the area
Home Values in the Area
Average Home Value in this Area
Purchase History
| Date | Buyer | Sale Price | Title Company |
|---|---|---|---|
| Schneider Christa | -- | None Available | |
| Hadass Zeev | $229,000 | -- | |
| Verhaege Koen | $194,900 | -- | |
| Pierson Pierson H | $175,900 | -- | |
| The Ryland Group Inc | $92,000 | -- |
Source: Public Records
Mortgage History
| Date | Status | Borrower | Loan Amount |
|---|---|---|---|
| Open | Hadass Zeev | $183,200 | |
| Previous Owner | Verhaege Koen | $146,000 |
Source: Public Records
Tax History Compared to Growth
Tax History
| Year | Tax Paid | Tax Assessment Tax Assessment Total Assessment is a certain percentage of the fair market value that is determined by local assessors to be the total taxable value of land and additions on the property. | Land | Improvement |
|---|---|---|---|---|
| 2025 | $11,902 | $347,200 | $192,700 | $154,500 |
| 2024 | $11,902 | $347,200 | $192,700 | $154,500 |
| 2023 | $11,885 | $347,200 | $192,700 | $154,500 |
| 2022 | $11,190 | $347,200 | $192,700 | $154,500 |
| 2021 | $11,093 | $347,200 | $192,700 | $154,500 |
| 2020 | $10,999 | $347,200 | $192,700 | $154,500 |
| 2019 | $10,923 | $347,200 | $192,700 | $154,500 |
| 2018 | $10,666 | $347,200 | $192,700 | $154,500 |
| 2017 | $10,503 | $347,200 | $192,700 | $154,500 |
| 2016 | $10,319 | $347,200 | $192,700 | $154,500 |
| 2015 | $10,090 | $347,200 | $192,700 | $154,500 |
| 2014 | $9,968 | $347,200 | $192,700 | $154,500 |
Source: Public Records
Map
Nearby Homes
- 52 Castleton Rd
- 53 Castleton Rd
- 77 Castleton Rd
- 54 Castleton Rd
- 76 Castleton Rd
- 55 Castleton Rd
- 75 Castleton Rd
- 56 Castleton Rd
- 74 Castleton Rd
- 73 Castleton Rd
- 46 Castleton Rd
- 61 Castleton Rd
- 45 Castleton Rd
- 62 Castleton Rd
- 72 Castleton Rd
- 63 Castleton Rd
- 306 Marten Rd
- 44 Castleton Rd
- 64 Castleton Rd
- 43 Castleton Rd