51 Channing St Worcester, MA 01605
Brittan Square NeighborhoodEstimated Value: $512,723 - $808,000
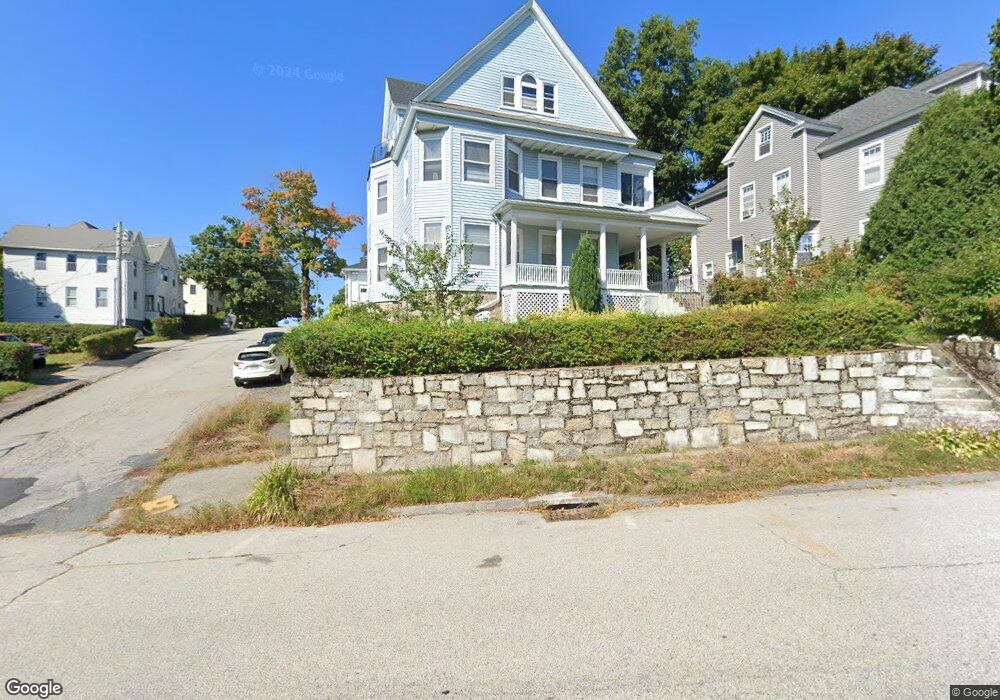
About This Home
This home is located at 51 Channing St, Worcester, MA 01605 and is currently estimated at $716,681, approximately $142 per square foot. 51 Channing St is a home located in Worcester County with nearby schools including Jacob Hiatt Magnet School, Chandler Magnet, and Burncoat Middle School.
Ownership History
We collect this data history from publicly available records. To have your information removed, we recommend requesting removal directly through your county’s website.
Purchase Details
Home Values in the Area
Average Home Value in this Area
Purchase History
We collect this data history from publicly available records. To have your information removed, we recommend requesting removal directly through your county’s website.
| Date | Buyer | Sale Price | Title Company |
|---|---|---|---|
| $269,900 | -- |
Tax History
We collect this data history from publicly available records. To have your information removed, we recommend requesting removal directly through your county’s website.
| Year | Tax Paid | Tax Assessment Tax Assessment Total Assessment is a certain percentage of the fair market value that is determined by local assessors to be the total taxable value of land and additions on the property. | Land | Improvement |
|---|---|---|---|---|
| 2025 | $9,221 | $699,100 | $84,700 | $614,400 |
| 2024 | $8,951 | $651,000 | $84,700 | $566,300 |
| 2023 | $8,293 | $578,300 | $73,700 | $504,600 |
| 2022 | $7,477 | $491,600 | $59,000 | $432,600 |
| 2021 | $6,248 | $383,800 | $47,200 | $336,600 |
| 2020 | $4,978 | $292,800 | $46,800 | $246,000 |
| 2019 | $5,164 | $286,900 | $40,900 | $246,000 |
| 2018 | $5,231 | $276,600 | $40,900 | $235,700 |
| 2017 | $4,938 | $256,900 | $40,900 | $216,000 |
| 2016 | $4,854 | $235,500 | $29,800 | $205,700 |
| 2015 | $4,726 | $235,500 | $29,800 | $205,700 |
| 2014 | $4,602 | $235,500 | $29,800 | $205,700 |
Map
- 15 Forestdale Rd
- 42 Windsor St
- 21 Perkins St
- 14 Mount Vernon St Unit A
- 10 Windsor St Unit E
- 19 Westminster St
- 139 Lincoln St
- 178 Lincoln St Unit 15
- 104 1/2 Rodney St
- 56 Paine St
- Lot 2 Ararat
- 37 Oak Ave
- 19 Henchman St
- 145 Eastern Ave
- 19 Denmark St
- 2 E Kendall St
- 80 Stanton St Unit 36
- 40 Duxbury Rd
- 51 Uxbridge St
- 15 Stanton St
- 53 Channing St
- 28 Windsor St
- 40 Perkins St
- 55 Channing St
- 30 Windsor St
- 48 Forbes St
- 48 Forbes St Unit 3
- 26 Windsor St
- 57 Channing St
- 32 Windsor St
- 49 Channing St
- 38 Parsons St
- 24 Windsor St
- 29 Windsor St
- 29 Windsor St Unit 2
- 27 Windsor St
- 27 Windsor St Unit 2
- 27 Windsor St
- 27 Windsor St Unit 1L
- 34 Perkins St
Ask me questions while you tour the home.