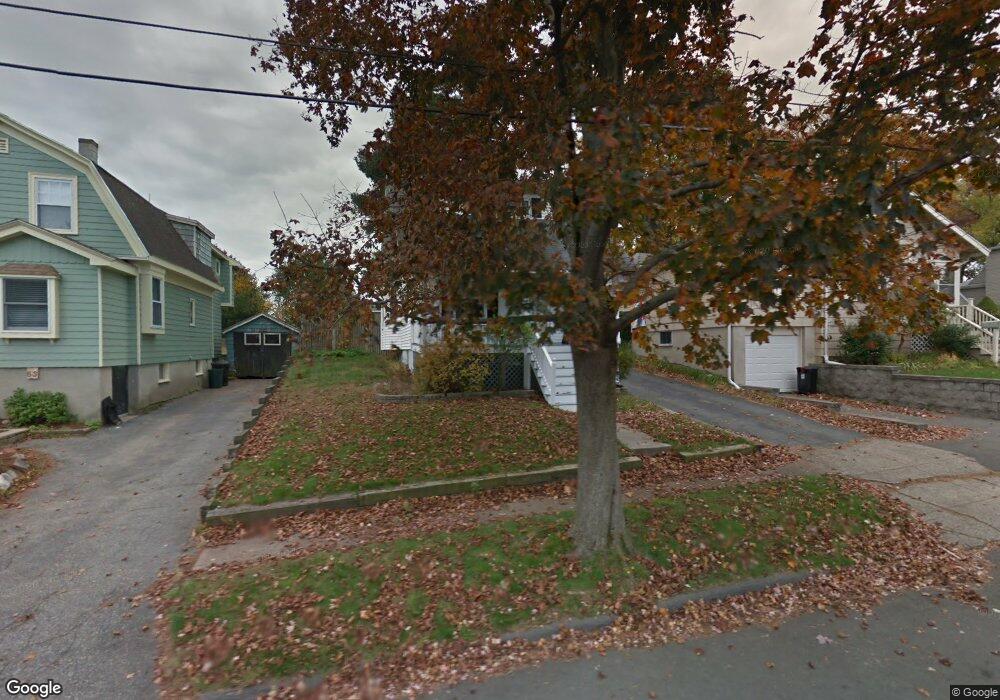
51 Chase St Danvers, MA 01923
Estimated Value: $543,268 - $628,000
2
Beds
1
Bath
1,122
Sq Ft
$532/Sq Ft
Est. Value
About This Home
This home is located at 51 Chase St, Danvers, MA 01923 and is currently estimated at $597,067, approximately $532 per square foot. 51 Chase St is a home located in Essex County with nearby schools including Danvers High School, St. Mary of the Annunciation School, and St. John's Prep.
Ownership History
Date
Name
Owned For
Owner Type
Purchase Details
Closed on
Dec 7, 2020
Sold by
Ryan Amanda
Bought by
Alves Fabio and Ryan Amanda
Current Estimated Value
Home Financials for this Owner
Home Financials are based on the most recent Mortgage that was taken out on this home.
Original Mortgage
$284,000
Outstanding Balance
$253,195
Interest Rate
2.7%
Mortgage Type
New Conventional
Estimated Equity
$343,872
Purchase Details
Closed on
Aug 30, 2017
Sold by
Fuher Cynthia A
Bought by
Ryan Amanda
Home Financials for this Owner
Home Financials are based on the most recent Mortgage that was taken out on this home.
Original Mortgage
$291,620
Interest Rate
3.96%
Mortgage Type
FHA
Purchase Details
Closed on
Oct 27, 2000
Sold by
Deluca Janet A and Rudd Janet A
Bought by
Okeefe Candace L and Hunt James C
Purchase Details
Closed on
Oct 12, 1994
Sold by
Demirdogen Sevan and Demirdogen Cheryl
Bought by
Rudd Janet A
Create a Home Valuation Report for This Property
The Home Valuation Report is an in-depth analysis detailing your home's value as well as a comparison with similar homes in the area
Home Values in the Area
Average Home Value in this Area
Purchase History
| Date | Buyer | Sale Price | Title Company |
|---|---|---|---|
| Alves Fabio | -- | None Available | |
| Ryan Amanda | $297,000 | -- | |
| Okeefe Candace L | $215,000 | -- | |
| Rudd Janet A | $135,000 | -- |
Source: Public Records
Mortgage History
| Date | Status | Borrower | Loan Amount |
|---|---|---|---|
| Open | Alves Fabio | $284,000 | |
| Previous Owner | Ryan Amanda | $291,620 | |
| Previous Owner | Rudd Janet A | $60,400 |
Source: Public Records
Tax History
| Year | Tax Paid | Tax Assessment Tax Assessment Total Assessment is a certain percentage of the fair market value that is determined by local assessors to be the total taxable value of land and additions on the property. | Land | Improvement |
|---|---|---|---|---|
| 2025 | $5,263 | $478,900 | $320,500 | $158,400 |
| 2024 | $5,121 | $460,900 | $309,500 | $151,400 |
| 2023 | $4,937 | $420,200 | $279,600 | $140,600 |
| 2022 | $4,864 | $384,200 | $254,200 | $130,000 |
| 2021 | $4,747 | $355,600 | $242,000 | $113,600 |
| 2020 | $4,549 | $348,300 | $242,000 | $106,300 |
| 2019 | $4,236 | $319,000 | $210,000 | $109,000 |
| 2018 | $4,134 | $305,300 | $210,000 | $95,300 |
| 2017 | $4,014 | $282,900 | $191,200 | $91,700 |
| 2016 | $3,854 | $271,400 | $182,400 | $89,000 |
| 2015 | $3,637 | $243,900 | $160,300 | $83,600 |
Source: Public Records
Map
Nearby Homes
- 61 High St
- 14 Chase St
- 35 High St Unit 3D
- 6 Grant St
- 20 Central Ave
- 10 Cottage Ave
- 147 High St
- 5 Holten St
- 14 Grove St
- 108 Abington Rd Unit 108
- 35 Locust St Unit 3
- 2 Chapel Rd
- 44 Foster St
- 14 Williams St Unit C17
- 43 Hobart St Unit B
- 22 Maple Ave
- 55 Burley St
- 63 Adams St
- 76 Water St
- 6 Mcdewell Ave Unit 4
Your Personal Tour Guide
Ask me questions while you tour the home.