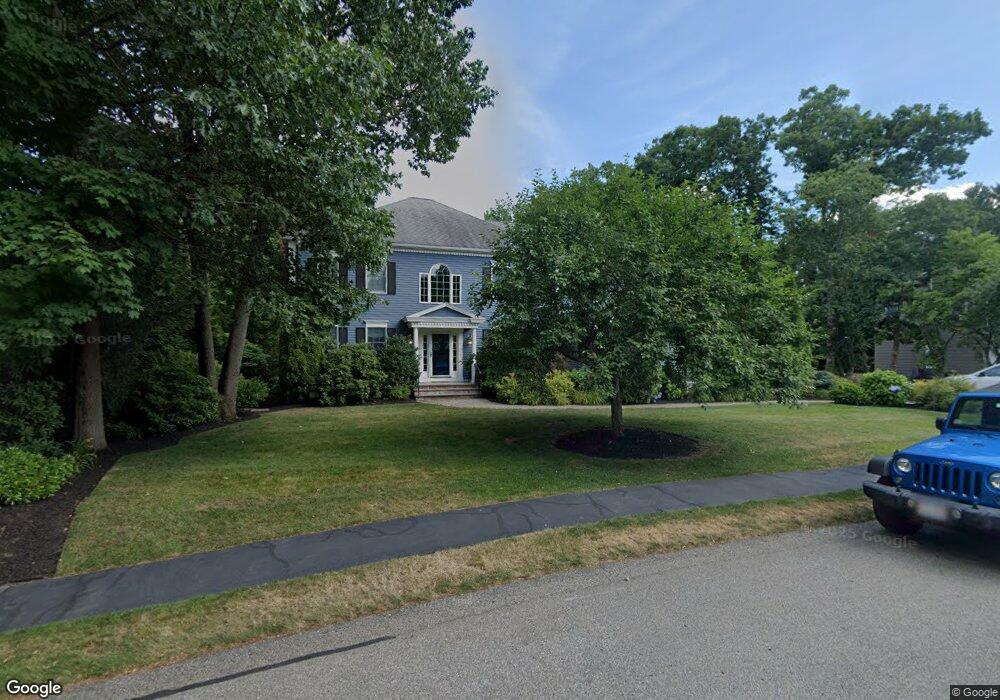
51 Clarke Cir Needham, MA 02492
Needham AreaEstimated Value: $2,288,000 - $3,144,000
About This Home
This home is located at 51 Clarke Cir, Needham, MA 02492 and is currently estimated at $2,838,078, approximately $1,381 per square foot. 51 Clarke Cir is a home located in Norfolk County with nearby schools including Sunita L. Williams Elementary School, High Rock Middle School, and Pollard Middle School.
Ownership History
We collect this data history from publicly available records. To have your information removed, we recommend requesting removal directly through your county’s website.
Purchase Details
Purchase Details
Home Values in the Area
Average Home Value in this Area
Purchase History
We collect this data history from publicly available records. To have your information removed, we recommend requesting removal directly through your county’s website.
| Date | Buyer | Sale Price | Title Company |
|---|---|---|---|
| -- | -- | ||
| $1,245,000 | -- |
Tax History
We collect this data history from publicly available records. To have your information removed, we recommend requesting removal directly through your county’s website.
| Year | Tax Paid | Tax Assessment Tax Assessment Total Assessment is a certain percentage of the fair market value that is determined by local assessors to be the total taxable value of land and additions on the property. | Land | Improvement |
|---|---|---|---|---|
| 2025 | $28,094 | $2,650,400 | $1,109,600 | $1,540,800 |
| 2024 | $26,496 | $2,116,300 | $621,900 | $1,494,400 |
| 2023 | $25,990 | $1,993,100 | $621,900 | $1,371,200 |
| 2022 | $25,149 | $1,881,000 | $576,900 | $1,304,100 |
| 2021 | $24,509 | $1,881,000 | $576,900 | $1,304,100 |
| 2020 | $22,983 | $1,840,100 | $576,900 | $1,263,200 |
| 2019 | $21,624 | $1,745,300 | $525,800 | $1,219,500 |
| 2018 | $20,545 | $1,729,400 | $525,800 | $1,203,600 |
| 2017 | $18,709 | $1,573,500 | $525,800 | $1,047,700 |
| 2016 | $18,286 | $1,584,600 | $525,800 | $1,058,800 |
| 2015 | $17,890 | $1,584,600 | $525,800 | $1,058,800 |
| 2014 | $17,249 | $1,481,900 | $479,300 | $1,002,600 |
Map
- 89 Rolling Ln
- 47 Rolling Ln
- 27 Rolling Ln
- 876 Central Ave
- 81 Parish Rd
- 102 Booth St
- 213 Hunnewell St
- 114 Parish Rd
- 17 Sunrise Terrace
- 279 Oakland St
- 6 Ardmore Rd
- 48 Taylor St
- 180 Meetinghouse Cir
- 17 Whiting Way
- 179 Oakland St
- 16 Stockdale Rd
- 151 Oakland St
- 300 Hunnewell St
- 312 Hunnewell St Unit 1
- 319 Oakland St
Ask me questions while you tour the home.