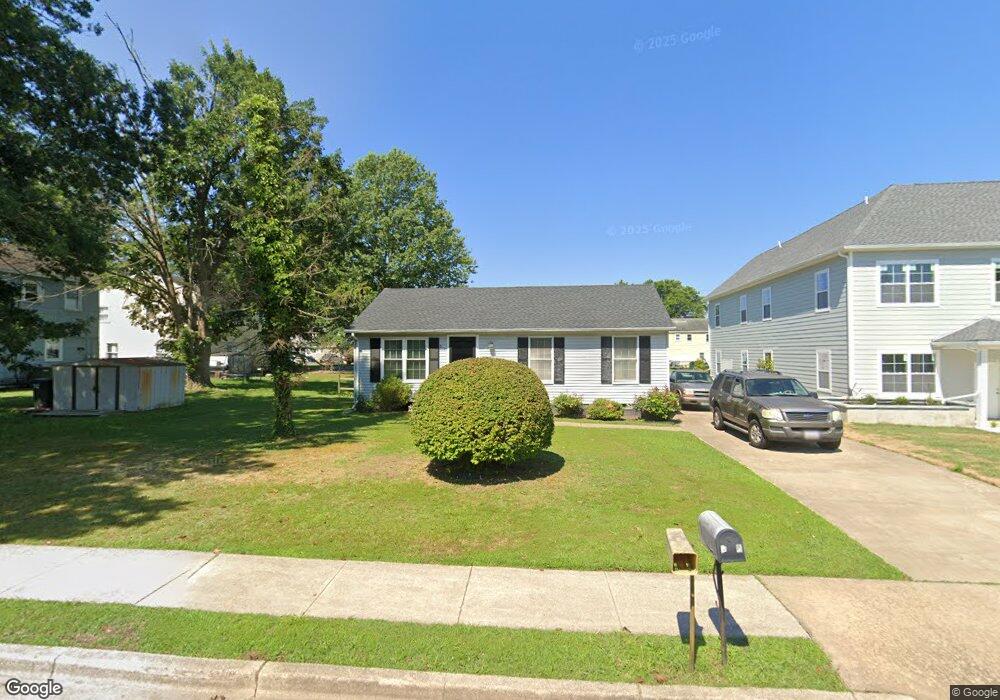
51 Clay St Easton, MD 21601
Estimated Value: $225,962 - $313,000
--
Bed
1
Bath
1,064
Sq Ft
$261/Sq Ft
Est. Value
About This Home
This home is located at 51 Clay St, Easton, MD 21601 and is currently estimated at $277,241, approximately $260 per square foot. 51 Clay St is a home located in Talbot County with nearby schools including Easton Elementary School, Easton Middle School, and Easton High School.
Ownership History
Date
Name
Owned For
Owner Type
Purchase Details
Closed on
Apr 30, 2004
Sold by
Sampson Algie
Bought by
Sampson Algie and Sampson Rosetta
Current Estimated Value
Purchase Details
Closed on
Feb 6, 1990
Sold by
Ventures R and Ventures B
Bought by
Sampson Algie
Home Financials for this Owner
Home Financials are based on the most recent Mortgage that was taken out on this home.
Original Mortgage
$55,000
Interest Rate
10.17%
Purchase Details
Closed on
Jun 14, 1989
Sold by
Poney Charles E and Poney Marie
Bought by
Ventures R and Ventures B
Create a Home Valuation Report for This Property
The Home Valuation Report is an in-depth analysis detailing your home's value as well as a comparison with similar homes in the area
Home Values in the Area
Average Home Value in this Area
Purchase History
| Date | Buyer | Sale Price | Title Company |
|---|---|---|---|
| Sampson Algie | -- | -- | |
| Sampson Algie | $55,000 | -- | |
| Ventures R | $12,000 | -- |
Source: Public Records
Mortgage History
| Date | Status | Borrower | Loan Amount |
|---|---|---|---|
| Previous Owner | Sampson Algie | $55,000 |
Source: Public Records
Tax History Compared to Growth
Tax History
| Year | Tax Paid | Tax Assessment Tax Assessment Total Assessment is a certain percentage of the fair market value that is determined by local assessors to be the total taxable value of land and additions on the property. | Land | Improvement |
|---|---|---|---|---|
| 2025 | $424 | $163,800 | $0 | $0 |
| 2024 | $424 | $153,600 | $66,000 | $87,600 |
| 2023 | $992 | $144,267 | $0 | $0 |
| 2022 | $362 | $134,933 | $0 | $0 |
| 2021 | $330 | $125,600 | $49,300 | $76,300 |
| 2020 | $330 | $121,900 | $0 | $0 |
| 2019 | $326 | $118,200 | $0 | $0 |
| 2018 | $312 | $114,500 | $49,300 | $65,200 |
| 2017 | $298 | $114,500 | $0 | $0 |
| 2016 | $298 | $114,500 | $0 | $0 |
| 2015 | $274 | $128,000 | $0 | $0 |
| 2014 | $274 | $128,000 | $0 | $0 |
Source: Public Records
Map
Nearby Homes
- 222 W Dover St
- 220 W Dover St
- 202 Tubman Dr
- 227 Bethune Dr
- 304 Wheatley Dr
- 66 Johnson St
- 26 S Washington St
- 33 S Harrison St
- 11 Brookletts Ave
- 133 N Washington St
- 295 Bay St Unit 4
- 115 South St
- 205 S Hanson St
- 28522 Waterview Dr
- 13 N Thoroughgood Ln
- 22 Londonderry Dr
- 203 E Earle Ave
- 20 S Aurora St
- 412 Trippe Ave
- 305 S Aurora St