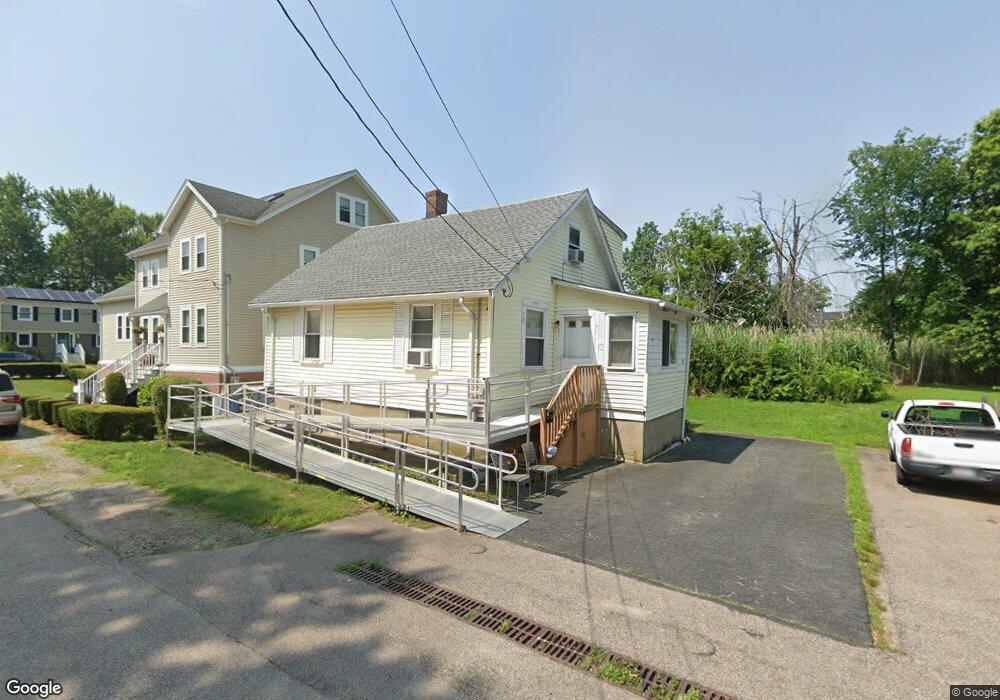
51 Cleaves St Quincy, MA 02170
Wollaston NeighborhoodEstimated Value: $598,000 - $687,000
3
Beds
2
Baths
1,092
Sq Ft
$587/Sq Ft
Est. Value
About This Home
This home is located at 51 Cleaves St, Quincy, MA 02170 and is currently estimated at $641,099, approximately $587 per square foot. 51 Cleaves St is a home located in Norfolk County with nearby schools including Beechwood Knoll Elementary School, Central Middle School, and North Quincy High School.
Ownership History
Date
Name
Owned For
Owner Type
Purchase Details
Closed on
Jun 16, 2021
Sold by
Lee Chun Y and Lee May L
Bought by
Chun Yu Lee Ret
Current Estimated Value
Purchase Details
Closed on
Sep 18, 1989
Sold by
Coughlin William J
Bought by
Lee Chun Y
Home Financials for this Owner
Home Financials are based on the most recent Mortgage that was taken out on this home.
Original Mortgage
$107,000
Interest Rate
9.58%
Mortgage Type
Purchase Money Mortgage
Create a Home Valuation Report for This Property
The Home Valuation Report is an in-depth analysis detailing your home's value as well as a comparison with similar homes in the area
Home Values in the Area
Average Home Value in this Area
Purchase History
| Date | Buyer | Sale Price | Title Company |
|---|---|---|---|
| Chun Yu Lee Ret | -- | None Available | |
| Lee Chun Y | $137,000 | -- |
Source: Public Records
Mortgage History
| Date | Status | Borrower | Loan Amount |
|---|---|---|---|
| Previous Owner | Lee Chun Y | $107,000 | |
| Previous Owner | Lee Chun Y | $43,000 |
Source: Public Records
Tax History
| Year | Tax Paid | Tax Assessment Tax Assessment Total Assessment is a certain percentage of the fair market value that is determined by local assessors to be the total taxable value of land and additions on the property. | Land | Improvement |
|---|---|---|---|---|
| 2025 | $5,834 | $506,000 | $289,100 | $216,900 |
| 2024 | $5,553 | $492,700 | $289,100 | $203,600 |
| 2023 | $5,181 | $465,500 | $275,300 | $190,200 |
| 2022 | $4,770 | $398,200 | $220,300 | $177,900 |
| 2021 | $4,749 | $391,200 | $220,300 | $170,900 |
| 2020 | $4,802 | $386,300 | $220,300 | $166,000 |
| 2019 | $4,421 | $352,300 | $205,800 | $146,500 |
| 2018 | $4,370 | $327,600 | $187,200 | $140,400 |
| 2017 | $4,339 | $306,200 | $187,200 | $119,000 |
| 2016 | $4,048 | $281,900 | $170,100 | $111,800 |
| 2015 | $3,824 | $261,900 | $154,700 | $107,200 |
| 2014 | $3,587 | $241,400 | $147,300 | $94,100 |
Source: Public Records
Map
Nearby Homes
- 9 Chick St
- 10 W Elm Ave
- 11 Gould St
- 28 Apthorp St
- 19 Bass St
- 20 Ellington Rd
- 27 Herbert Rd
- 163 Clay St Unit 3
- 10 Weston Ave Unit 322
- 100 Grand View Ave Unit 9C
- 297 Billings St
- 135 E Squantum St
- 267-269 Farrington St
- 915 Hancock St Unit 2
- 85 E Squantum St Unit 10
- 45 Oval Rd Unit 34
- 107 Fayette St
- 17 Holmes St Unit 204
- 17 Holmes St Unit 2
- 17 Holmes St Unit 1
Your Personal Tour Guide
Ask me questions while you tour the home.