NOT LISTED FOR SALE

51 Cleaves St Yarmouth, ME 04096

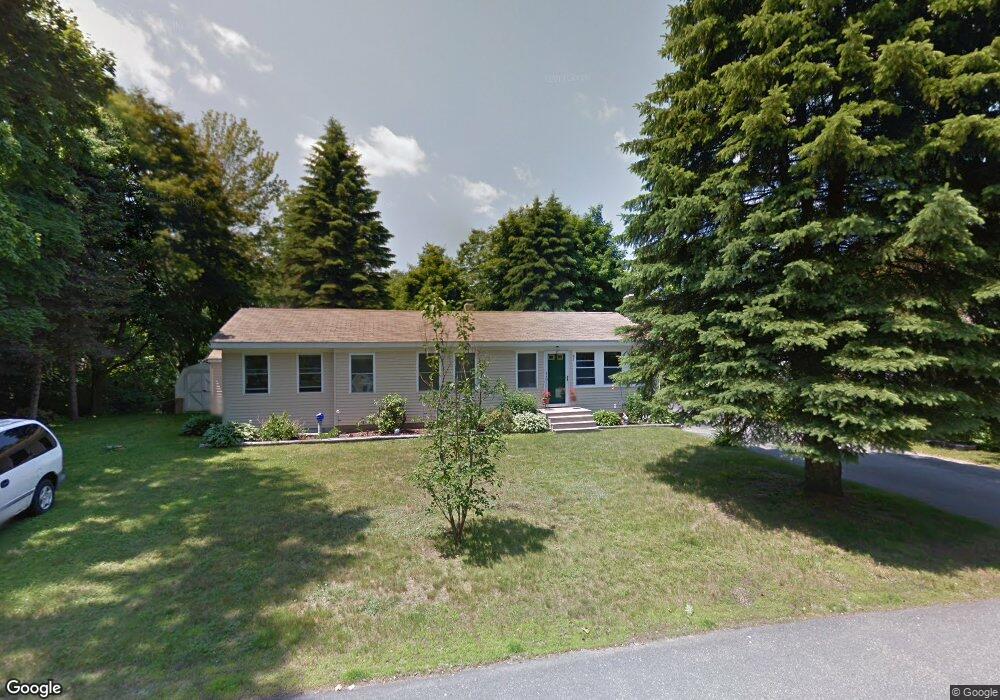
Estimated Value: $557,077 - $606,000

3 Beds
2 Baths
1,551 Sq Ft
$376/Sq Ft Est. Value

Last Sold June 18, 2015

Last sale price $210,000 $135 Per Sq Ft

Est. 178% increase in value since last sale

Current estimated payment $3,607/month

About This Home

Charming 3 BR Ranch offering hardwood floors throughout. New addition in 2008 expanded two bedrooms w/beautiful wood cathedral ceilings. Bathroom offers tile floor & jetted tub. Eat-in kitchen with mudroom area, radiant heat, sliding glass door to spacious deck. Fenced in backyard for privacy. Enjoy walking everywhere in this convenient downtown historic Yarmouth village!

Ownership History

Date Name Owned For Owner Type

Purchase Details

Listed on
Jul 27, 2015
Closed on
Jun 22, 2015
Sold by
Clifford Philip A and Clifford Gale P
Bought by
Olivadoti Robert F and Olivadoti Alanna
Seller's Agent
Lori Dimick
Century 21 First Choice Realty
Buyer's Agent
Lori Dimick
Century 21 First Choice Realty
List Price
$215,000
Sold Price
$210,000
Premium/Discount to List
-$5,000
-2.33%
Current Estimated Value
$582,769

Home Financials for this Owner

Home Financials are based on the most recent Mortgage that was taken out on this home.
Estimated Appreciation
$372,769
Avg. Annual Appreciation
10.34%
Original Mortgage
$157,500
Interest Rate
3.78%
Mortgage Type
New Conventional
Source: Public Records

Range of Values:

Collateral Analytics

Collateral Analytics Collateral Analytics AVMs (Automated Valuation Model) employ a number of statistical approaches combined with neighborhood-specific comparable selection guarantees the most up-to-date and precise valuations.

Not Available

Collateral Analytics does not have data for the current month. Please view the chart for historical values.

ICE

ICE Mortgage Technology ICE Mortgage Technology’s AVM (Automated Valuation Model) is a state-of-the-art online residential property valuation tool that provides a quick and accurate estimate of the value of almost any home in the U.S.

Not Available

ICE Mortgage Technology does not have data for the current month. Please view the chart for historical values.

First American

First American First American Data & Analytics’ next-generation AVM combines unrivaled data assets with a blended ensemble of valuation models to produce highly accurate, reliable valuations you can trust.

Not Available

First American does not have data for the current month. Please view the chart for historical values.

Quantarium

Quantarium Quantarium’s valuation service, repeatedly proven the industry’s most accurate and comprehensive, is supercharged with a self-learning and auto-tuning AI engine that continually becomes smarter and more accurate as it processes daily inputs from the industry’s leading RE data lake.

Not Available

Quantarium does not have data for the current month. Please view the chart for historical values.

Average Value
Not Available
List Price
Sold Price
Create a Home Valuation Report for This Property
The Home Valuation Report is an in-depth analysis detailing your home's value as well as a comparison with similar homes in the area

Home Values in the Area

Source: Public Records

Average Home Value in this Area


Source: Public Records

Purchase History

Date Buyer Sale Price Title Company
Olivadoti Robert F -- --
Source: Public Records

Mortgage History

Date Status Borrower Loan Amount
Closed Olivadoti Robert F $157,500
Source: Public Records

Property History

Date Event Price List to Sale Price per Sq Ft Prior Sale
07/27/2015 07/27/15 For Sale $215,000 +2.4% $139 / Sq Ft
06/18/2015 06/18/15 Sold $210,000 -- $135 / Sq Ft View Prior Sale
04/01/2015 04/01/15 Pending -- -- --

Tax History Compared to Growth

Source: Public Records

Tax History

Year Tax Paid Tax Assessment Tax Assessment Total Assessment is a certain percentage of the fair market value that is determined by local assessors to be the total taxable value of land and additions on the property. Land Improvement
2024 $6,607 $257,400 $110,000 $147,400
2023 $6,059 $257,400 $110,000 $147,400
2022 $5,565 $257,400 $110,000 $147,400
2021 $5,097 $257,400 $110,000 $147,400
2020 $4,930 $257,400 $110,000 $147,400
2019 $4,855 $257,400 $110,000 $147,400
2018 $4,582 $257,400 $110,000 $147,400
2017 $1,974 $252,200 $110,000 $142,200
2016 $4,229 $247,900 $110,000 $137,900
2015 $3,475 $161,200 $90,300 $70,900
2014 $3,482 $161,200 $90,300 $70,900
2013 $3,546 $161,200 $0 $0
Source: Public Records

Agents Affiliated with this Home

  • Section Image
See All Agents

Map