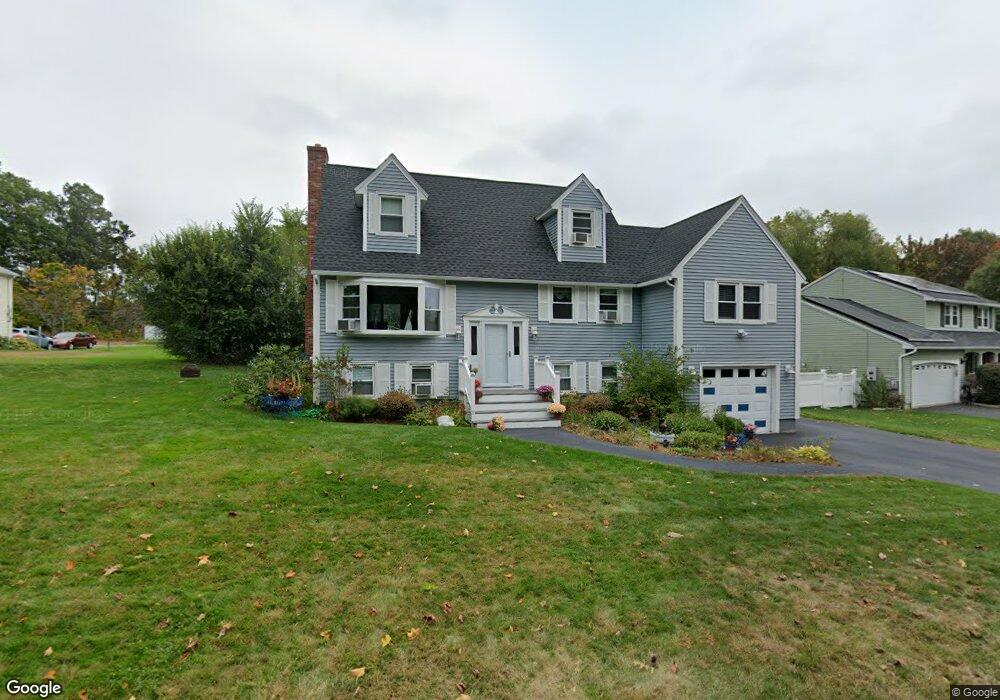
51 Clementi Ln Methuen, MA 01844
The East End NeighborhoodEstimated Value: $667,284 - $728,000
3
Beds
3
Baths
2,531
Sq Ft
$280/Sq Ft
Est. Value
About This Home
This home is located at 51 Clementi Ln, Methuen, MA 01844 and is currently estimated at $707,571, approximately $279 per square foot. 51 Clementi Ln is a home located in Essex County with nearby schools including South Point Elementary School, Methuen High School, and Community Day Charter Public School - Gateway.
Ownership History
Date
Name
Owned For
Owner Type
Purchase Details
Closed on
Jul 25, 2017
Sold by
Languirand Wendy S and Languirand Joseph A
Bought by
Languirand Joseph A and Languirand Wendy S
Current Estimated Value
Purchase Details
Closed on
Dec 11, 2014
Sold by
Languirand Joseph A and Languirand Wendy S
Bought by
Languirand Wendy S and Languirand Joseph A
Home Financials for this Owner
Home Financials are based on the most recent Mortgage that was taken out on this home.
Original Mortgage
$295,000
Interest Rate
3.98%
Mortgage Type
New Conventional
Purchase Details
Closed on
Dec 22, 2003
Sold by
Kettering Andrew E and Kettering Kristine
Bought by
Languirand Joseph A and Languirand Wendy S
Purchase Details
Closed on
Jan 31, 2000
Sold by
Zacharias Richard G and Zacharias Sharon A
Bought by
Kettering Andrew E and Kettering Kristine
Create a Home Valuation Report for This Property
The Home Valuation Report is an in-depth analysis detailing your home's value as well as a comparison with similar homes in the area
Home Values in the Area
Average Home Value in this Area
Purchase History
| Date | Buyer | Sale Price | Title Company |
|---|---|---|---|
| Languirand Joseph A | -- | -- | |
| Languirand Joseph A | -- | -- | |
| Languirand Joseph A | -- | -- | |
| Languirand Wendy S | -- | -- | |
| Languirand Wendy S | -- | -- | |
| Languirand Wendy S | -- | -- | |
| Languirand Joseph A | $358,000 | -- | |
| Languirand Joseph A | $358,000 | -- | |
| Kettering Andrew E | $241,000 | -- | |
| Kettering Andrew E | $241,000 | -- |
Source: Public Records
Mortgage History
| Date | Status | Borrower | Loan Amount |
|---|---|---|---|
| Previous Owner | Languirand Wendy S | $295,000 |
Source: Public Records
Tax History Compared to Growth
Tax History
| Year | Tax Paid | Tax Assessment Tax Assessment Total Assessment is a certain percentage of the fair market value that is determined by local assessors to be the total taxable value of land and additions on the property. | Land | Improvement |
|---|---|---|---|---|
| 2025 | $6,073 | $574,000 | $207,200 | $366,800 |
| 2024 | $5,892 | $542,500 | $182,000 | $360,500 |
| 2023 | $5,596 | $478,300 | $161,000 | $317,300 |
| 2022 | $5,293 | $405,600 | $140,000 | $265,600 |
| 2021 | $5,258 | $398,600 | $133,000 | $265,600 |
| 2020 | $5,232 | $389,300 | $133,000 | $256,300 |
| 2019 | $5,019 | $353,700 | $126,000 | $227,700 |
| 2018 | $4,675 | $327,600 | $119,000 | $208,600 |
| 2017 | $4,799 | $327,600 | $119,000 | $208,600 |
| 2016 | $4,570 | $308,600 | $119,000 | $189,600 |
| 2015 | $4,348 | $297,800 | $112,000 | $185,800 |
Source: Public Records
Map
Nearby Homes
- 45 Christopher Dr Unit 101
- 29 Wallace St
- 17 Ferry Rd
- 2 Goodrich Ave
- 27 Russell Farm Dr
- 23 Constitution Way Unit 23
- 23 Constitution Way
- 95 Pilgrim Cir Unit 95
- 107 Farrwood Dr Unit 107
- 49 Golf Ave
- 369 Farrwood Dr
- 68 Sterling Ln
- 406 Farrwood Dr Unit 406
- 414 Farrwood Dr Unit 414
- 86 Comet Rd
- 128 Bradford St
- 128 Pleasant Valley St
- 6 Aberdeen Rd
- 14 S Riverview St
- 49 Ferry Rd