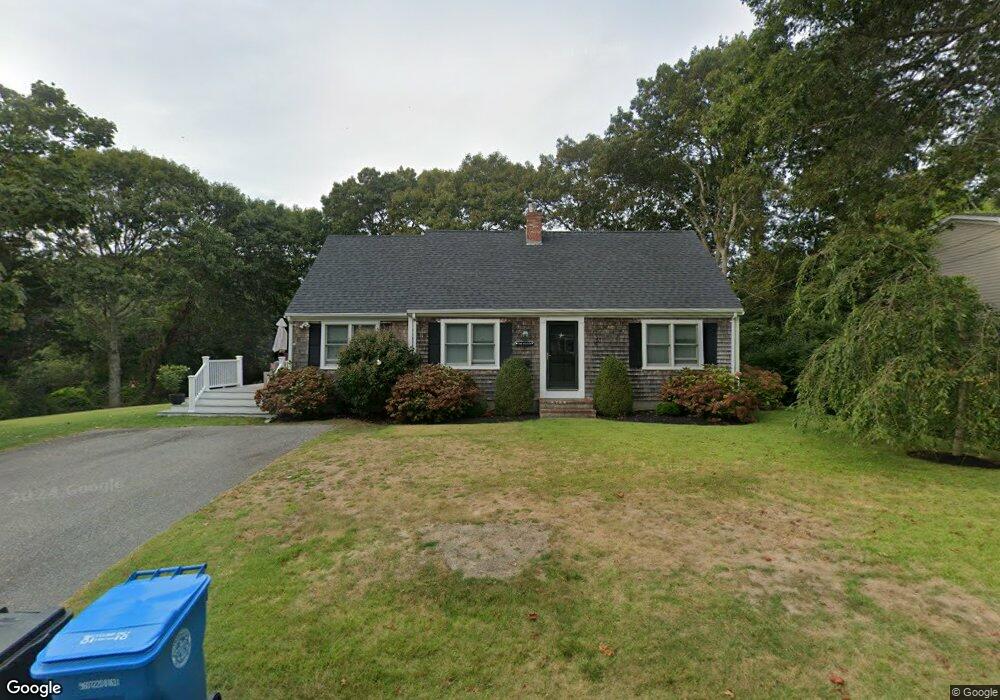
51 Cooper Rd East Falmouth, MA 02536
Estimated Value: $961,843 - $1,161,000
4
Beds
2
Baths
1,620
Sq Ft
$655/Sq Ft
Est. Value
About This Home
This home is located at 51 Cooper Rd, East Falmouth, MA 02536 and is currently estimated at $1,061,711, approximately $655 per square foot. 51 Cooper Rd is a home located in Barnstable County with nearby schools including Teaticket Elementary School, Morse Pond School, and Lawrence School.
Ownership History
Date
Name
Owned For
Owner Type
Purchase Details
Closed on
Sep 9, 2024
Sold by
Foley Daniel and Foley Margaret
Bought by
51 Cooper Rd Rt and Foley
Current Estimated Value
Purchase Details
Closed on
Jun 26, 2009
Sold by
Ethel T Lowther Ret and Colombo
Bought by
Foley Daniel and Foley Margaret
Purchase Details
Closed on
Apr 28, 2006
Sold by
Lowther Ethel T
Bought by
Ethel T Lowther Ret and Lowther
Create a Home Valuation Report for This Property
The Home Valuation Report is an in-depth analysis detailing your home's value as well as a comparison with similar homes in the area
Home Values in the Area
Average Home Value in this Area
Purchase History
| Date | Buyer | Sale Price | Title Company |
|---|---|---|---|
| 51 Cooper Rd Rt | -- | None Available | |
| 51 Cooper Rd Rt | -- | None Available | |
| 51 Cooper Rd Rt | -- | None Available | |
| Foley Daniel | $430,000 | -- | |
| Ethel T Lowther Ret | -- | -- | |
| Foley Daniel | $430,000 | -- | |
| Ethel T Lowther Ret | -- | -- |
Source: Public Records
Tax History Compared to Growth
Tax History
| Year | Tax Paid | Tax Assessment Tax Assessment Total Assessment is a certain percentage of the fair market value that is determined by local assessors to be the total taxable value of land and additions on the property. | Land | Improvement |
|---|---|---|---|---|
| 2025 | $4,825 | $821,900 | $406,000 | $415,900 |
| 2024 | $4,682 | $745,500 | $369,100 | $376,400 |
| 2023 | $4,279 | $618,300 | $295,300 | $323,000 |
| 2022 | $4,019 | $499,200 | $244,500 | $254,700 |
| 2021 | $3,886 | $457,200 | $233,900 | $223,300 |
| 2020 | $3,744 | $435,900 | $212,600 | $223,300 |
| 2019 | $3,684 | $430,400 | $212,600 | $217,800 |
| 2018 | $3,238 | $376,500 | $212,600 | $163,900 |
| 2017 | $3,165 | $371,000 | $212,600 | $158,400 |
| 2016 | $3,105 | $371,000 | $212,600 | $158,400 |
| 2015 | $3,038 | $371,000 | $212,600 | $158,400 |
| 2014 | $3,014 | $369,800 | $212,700 | $157,100 |
Source: Public Records
Map
Nearby Homes