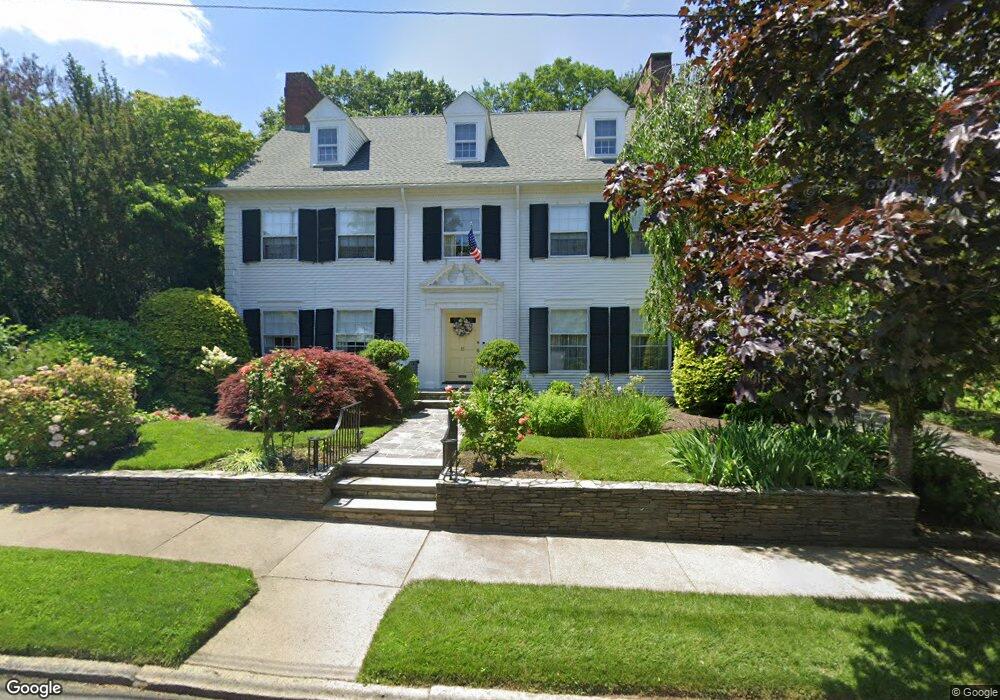
51 Dryden Ave Pawtucket, RI 02860
Oak Hill NeighborhoodEstimated Value: $1,142,000 - $1,323,000
5
Beds
4
Baths
3,630
Sq Ft
$331/Sq Ft
Est. Value
About This Home
This home is located at 51 Dryden Ave, Pawtucket, RI 02860 and is currently estimated at $1,202,151, approximately $331 per square foot. 51 Dryden Ave is a home located in Providence County with nearby schools including International Charter School, Blackstone Academy Charter School, and Ocean Tides School.
Ownership History
Date
Name
Owned For
Owner Type
Purchase Details
Closed on
Nov 30, 2021
Sold by
Stanford Donald L and Stanford Jane P
Bought by
Stanford Ft
Current Estimated Value
Create a Home Valuation Report for This Property
The Home Valuation Report is an in-depth analysis detailing your home's value as well as a comparison with similar homes in the area
Home Values in the Area
Average Home Value in this Area
Purchase History
| Date | Buyer | Sale Price | Title Company |
|---|---|---|---|
| Stanford Ft | -- | None Available |
Source: Public Records
Tax History Compared to Growth
Tax History
| Year | Tax Paid | Tax Assessment Tax Assessment Total Assessment is a certain percentage of the fair market value that is determined by local assessors to be the total taxable value of land and additions on the property. | Land | Improvement |
|---|---|---|---|---|
| 2025 | $10,866 | $826,300 | $411,300 | $415,000 |
| 2024 | $10,197 | $826,300 | $411,300 | $415,000 |
| 2023 | $11,309 | $667,600 | $204,300 | $463,300 |
| 2022 | $11,069 | $667,600 | $204,300 | $463,300 |
| 2021 | $11,069 | $667,600 | $204,300 | $463,300 |
| 2020 | $10,714 | $512,900 | $172,000 | $340,900 |
| 2019 | $10,714 | $512,900 | $172,000 | $340,900 |
| 2018 | $10,325 | $512,900 | $172,000 | $340,900 |
| 2017 | $11,446 | $503,800 | $164,900 | $338,900 |
| 2016 | $11,028 | $503,800 | $164,900 | $338,900 |
| 2015 | $11,028 | $503,800 | $164,900 | $338,900 |
| 2014 | $11,306 | $490,300 | $158,600 | $331,700 |
Source: Public Records
Map
Nearby Homes
- 603 East Ave
- 640 East Ave
- 410 Pawtucket Ave
- 142 Ridge St
- 122 Lowden St
- 70 Dunnell Ave
- 26 Bowles Ct
- 64 Smith St
- 126 Dunnell Ave
- 207 Pawtucket Ave
- 199 Pawtucket Ave
- 50 Jefferson Ave
- 54 Jefferson Ave
- 136 Hillside Ave
- 141 Hillside Ave
- 167 George St
- 92 Jefferson Ave
- 32 Carver St
- 172 Chace Ave
- 151 Chace Ave