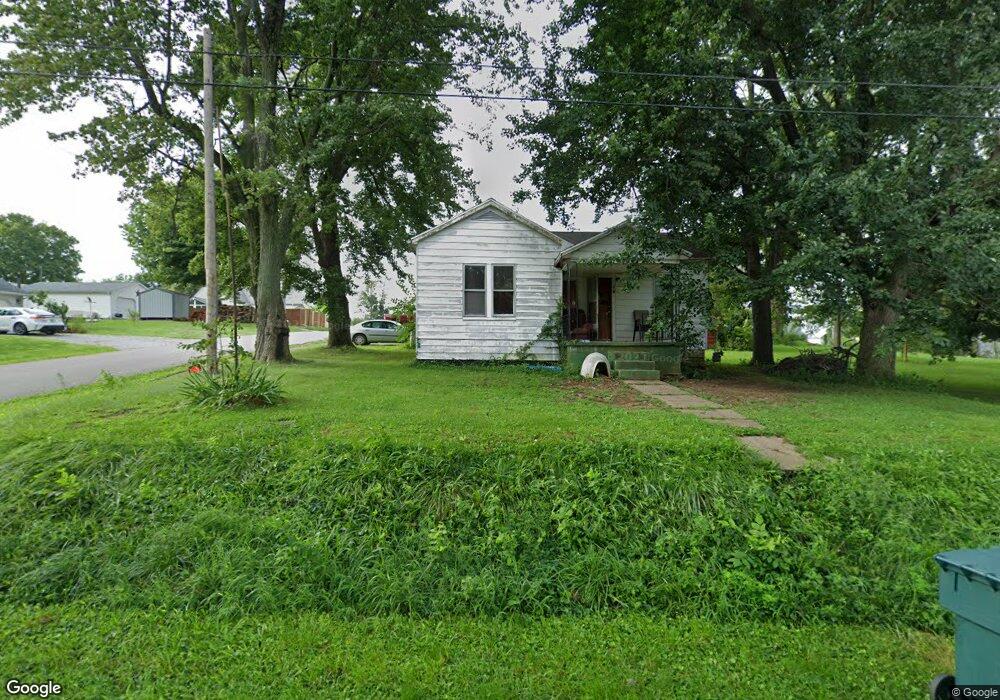
51 E Spring St Chrisney, IN 47611
Estimated Value: $80,638 - $146,000
2
Beds
1
Bath
1,090
Sq Ft
$105/Sq Ft
Est. Value
About This Home
This home is located at 51 E Spring St, Chrisney, IN 47611 and is currently estimated at $114,160, approximately $104 per square foot. 51 E Spring St is a home located in Spencer County with nearby schools including Heritage Hills High School.
Ownership History
Date
Name
Owned For
Owner Type
Purchase Details
Closed on
Sep 9, 2024
Sold by
Vaughn Tasha
Bought by
Wike Kendra
Current Estimated Value
Home Financials for this Owner
Home Financials are based on the most recent Mortgage that was taken out on this home.
Original Mortgage
$57,931
Outstanding Balance
$57,235
Interest Rate
6.12%
Mortgage Type
FHA
Estimated Equity
$56,925
Purchase Details
Closed on
May 8, 2020
Sold by
Parris Dalane R
Bought by
Jackson Joseph
Purchase Details
Closed on
Aug 14, 2011
Sold by
Bufkin Dariene R and Dolletski Sylvia R
Bought by
Parris Dalane J
Create a Home Valuation Report for This Property
The Home Valuation Report is an in-depth analysis detailing your home's value as well as a comparison with similar homes in the area
Purchase History
| Date | Buyer | Sale Price | Title Company |
|---|---|---|---|
| Wike Kendra | $59,000 | First American Title | |
| Jackson Joseph | -- | None Available | |
| Parris Dalane J | -- | None Available |
Source: Public Records
Mortgage History
| Date | Status | Borrower | Loan Amount |
|---|---|---|---|
| Open | Wike Kendra | $57,931 |
Source: Public Records
Tax History
| Year | Tax Paid | Tax Assessment Tax Assessment Total Assessment is a certain percentage of the fair market value that is determined by local assessors to be the total taxable value of land and additions on the property. | Land | Improvement |
|---|---|---|---|---|
| 2024 | $740 | $37,000 | $4,500 | $32,500 |
| 2023 | $702 | $35,100 | $3,500 | $31,600 |
| 2022 | $536 | $29,100 | $3,500 | $25,600 |
| 2021 | $494 | $24,700 | $3,500 | $21,200 |
| 2020 | $616 | $30,800 | $3,500 | $27,300 |
| 2019 | $616 | $30,800 | $3,500 | $27,300 |
| 2018 | $592 | $29,600 | $3,500 | $26,100 |
| 2017 | $583 | $29,200 | $3,500 | $25,700 |
| 2016 | $519 | $29,200 | $3,500 | $25,700 |
| 2014 | $518 | $25,900 | $3,500 | $22,400 |
| 2013 | $518 | $26,800 | $3,500 | $23,300 |
Source: Public Records
Map
Nearby Homes
- 220 S Main St
- 116 N Church St
- 118 N Main St
- 307 N Main St
- 7685 N County Road 550 E
- 9158 N Cr 600 E
- 615 9th St
- 815 Church St
- 40+/- Ac Off Cr 1100 N Unit LotWP001
- 711 Church St
- 8311 N 700 E Rd
- 0 S Church St
- 603 Main St
- 208 W Boone St
- 0 Cr 1100 Rd N Unit 202603590
- 0 N Base Rd
- 0 W Chestnut By the Fire
- 722 S Melchoir Dr W
- 781 S Sled Run
- 1706 N Orchard Rd
Your Personal Tour Guide
Ask me questions while you tour the home.