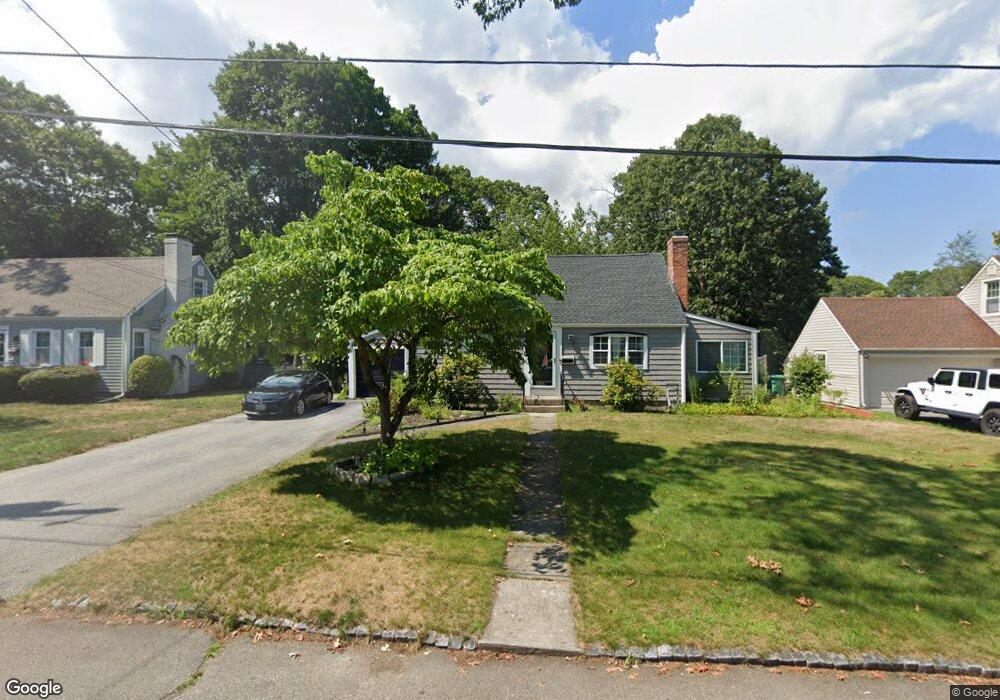
51 Edgehill Rd Warwick, RI 02889
Hoxie NeighborhoodEstimated Value: $422,000 - $474,000
4
Beds
2
Baths
2,109
Sq Ft
$216/Sq Ft
Est. Value
About This Home
This home is located at 51 Edgehill Rd, Warwick, RI 02889 and is currently estimated at $455,710, approximately $216 per square foot. 51 Edgehill Rd is a home located in Kent County with nearby schools including Saint Kevin School and Bishop Hendricken High School.
Ownership History
Date
Name
Owned For
Owner Type
Purchase Details
Closed on
Nov 25, 2024
Sold by
Mcgann Mary
Bought by
Mary E Mcgann Ret and Mcgann
Current Estimated Value
Purchase Details
Closed on
Nov 2, 2011
Sold by
Condon Glenn P
Bought by
Mcgann Mary and Newton Mortimer
Home Financials for this Owner
Home Financials are based on the most recent Mortgage that was taken out on this home.
Original Mortgage
$149,000
Interest Rate
4.08%
Mortgage Type
Purchase Money Mortgage
Purchase Details
Closed on
Nov 10, 2010
Sold by
Fnma
Bought by
Condon Glenn P
Purchase Details
Closed on
Aug 17, 2007
Sold by
Deutsche Bank Natl T C
Bought by
Fuller Richard E and Bassett Nancy
Purchase Details
Closed on
Nov 2, 2001
Sold by
Condon Glenn P
Bought by
Mcgann Mary and Newton Mortimer
Purchase Details
Closed on
Jun 15, 1990
Sold by
Doughty Kenneth W
Bought by
Conner Richard D
Create a Home Valuation Report for This Property
The Home Valuation Report is an in-depth analysis detailing your home's value as well as a comparison with similar homes in the area
Home Values in the Area
Average Home Value in this Area
Purchase History
| Date | Buyer | Sale Price | Title Company |
|---|---|---|---|
| Mary E Mcgann Ret | -- | None Available | |
| Mary E Mcgann Ret | -- | None Available | |
| Mary E Mcgann Ret | -- | None Available | |
| Mcgann Mary | $189,000 | -- | |
| Condon Glenn P | $140,000 | -- | |
| Fuller Richard E | $227,800 | -- | |
| Mcgann Mary | $189,000 | -- | |
| Conner Richard D | $129,500 | -- | |
| Mcgann Mary | $189,000 | -- | |
| Condon Glenn P | $140,000 | -- | |
| Fuller Richard E | $227,800 | -- | |
| Mcgann Mary | $189,000 | -- | |
| Conner Richard D | $129,500 | -- |
Source: Public Records
Mortgage History
| Date | Status | Borrower | Loan Amount |
|---|---|---|---|
| Previous Owner | Conner Richard D | $149,000 |
Source: Public Records
Tax History Compared to Growth
Tax History
| Year | Tax Paid | Tax Assessment Tax Assessment Total Assessment is a certain percentage of the fair market value that is determined by local assessors to be the total taxable value of land and additions on the property. | Land | Improvement |
|---|---|---|---|---|
| 2025 | $4,966 | $391,000 | $108,000 | $283,000 |
| 2024 | $4,664 | $322,300 | $93,900 | $228,400 |
| 2023 | $4,573 | $322,300 | $93,900 | $228,400 |
| 2022 | $4,490 | $239,700 | $66,800 | $172,900 |
| 2021 | $4,254 | $227,100 | $66,800 | $160,300 |
| 2020 | $4,254 | $227,100 | $66,800 | $160,300 |
| 2019 | $4,254 | $227,100 | $66,800 | $160,300 |
| 2018 | $3,781 | $181,800 | $66,800 | $115,000 |
| 2017 | $3,680 | $181,800 | $66,800 | $115,000 |
| 2016 | $3,680 | $181,800 | $66,800 | $115,000 |
| 2015 | $3,279 | $158,000 | $59,600 | $98,400 |
| 2014 | $3,169 | $158,000 | $59,600 | $98,400 |
| 2013 | $3,127 | $158,000 | $59,600 | $98,400 |
Source: Public Records
Map
Nearby Homes
- 67 Brewster Dr
- 32 Omaha Blvd
- 176 Vernon St
- 81 Yucatan Dr
- 26 Dallas Ave
- 40 Cavalcade Blvd
- 139 Yucatan Dr
- 418 Lake Shore Dr
- 12 Lima St
- 401 Lake Shore Dr
- 144 Hoxsie Ave
- 33 Recess Ln
- 52 Recess Ln
- 41 Recess Ln
- 107 Glenwood Dr
- 161 W Shore Rd Unit B5
- 33 Hargraves St
- 100 Aurora Dr
- 72 W Shore Rd Unit 104
- 78 Jennie Ln
- 59 Edgehill Rd
- 45 Edgehill Rd
- 50 Edgehill Rd
- 39 Edgehill Rd
- 65 Edgehill Rd
- 44 Edgehill Rd
- 58 Edgehill Rd
- 73 Edgehill Rd
- 88 Fairway Ln
- 62 Edgehill Rd
- 100 Fairway Ln
- 100 Fairway Ln Unit 1
- 31 Edgehill Rd
- 70 Edgehill Rd
- 38 Edgehill Rd
- 78 Edgehill Rd
- 81 Edgehill Rd
- 104 Fairway Ln
- 52 Warwick Lake Ave
- 25 Edgehill Rd