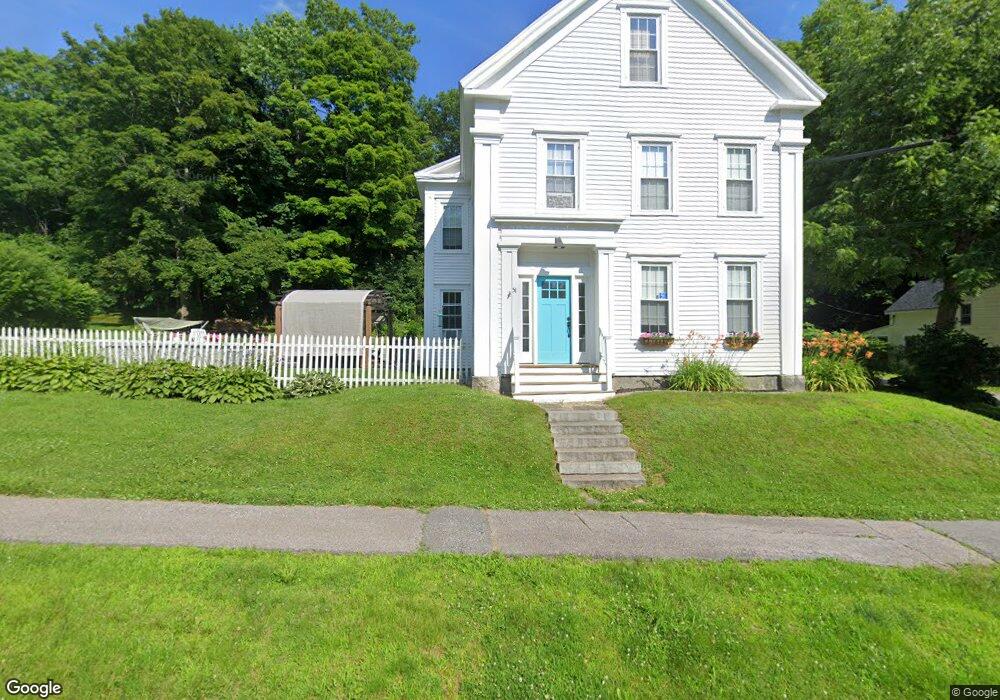
51 Elm St Bucksport, ME 04416
Estimated Value: $327,734 - $376,000
3
Beds
2
Baths
2,034
Sq Ft
$176/Sq Ft
Est. Value
About This Home
This home is located at 51 Elm St, Bucksport, ME 04416 and is currently estimated at $358,934, approximately $176 per square foot. 51 Elm St is a home with nearby schools including G. Herbert Jewett School, Miles Lane School, and Bucksport Middle School.
Ownership History
Date
Name
Owned For
Owner Type
Purchase Details
Closed on
Jun 29, 2012
Sold by
Neslusan Mark A
Bought by
Neslusan Mark A and Neslusan Cathleen M
Current Estimated Value
Purchase Details
Closed on
Oct 3, 2006
Sold by
Neslusan Mark A and Neslusan Suzanne
Bought by
Neslusan Mark A
Create a Home Valuation Report for This Property
The Home Valuation Report is an in-depth analysis detailing your home's value as well as a comparison with similar homes in the area
Home Values in the Area
Average Home Value in this Area
Purchase History
| Date | Buyer | Sale Price | Title Company |
|---|---|---|---|
| Neslusan Mark A | -- | -- | |
| Neslusan Mark A | -- | -- |
Source: Public Records
Tax History Compared to Growth
Tax History
| Year | Tax Paid | Tax Assessment Tax Assessment Total Assessment is a certain percentage of the fair market value that is determined by local assessors to be the total taxable value of land and additions on the property. | Land | Improvement |
|---|---|---|---|---|
| 2024 | $3,667 | $276,720 | $45,720 | $231,000 |
| 2023 | $3,528 | $276,720 | $45,720 | $231,000 |
| 2022 | $2,315 | $136,570 | $39,770 | $96,800 |
| 2021 | $2,219 | $136,570 | $39,770 | $96,800 |
| 2020 | $2,219 | $136,570 | $39,770 | $96,800 |
| 2019 | $2,226 | $136,570 | $39,770 | $96,800 |
| 2018 | $2,226 | $136,570 | $39,770 | $96,800 |
| 2017 | $2,212 | $134,860 | $50,650 | $84,210 |
| 2016 | $2,225 | $134,860 | $50,650 | $84,210 |
| 2015 | $2,223 | $130,000 | $51,000 | $79,000 |
| 2014 | $1,764 | $125,047 | $46,244 | $78,803 |
| 2013 | $1,696 | $125,040 | $46,240 | $78,800 |
Source: Public Records
Map
Nearby Homes
- 49 Mechanic St
- 105 Main St
- 21 Federal St
- 13 Buck St
- 23 Pond St
- 48 Pond St
- 63 Pond St
- Lot 96 Pond Street Extension St
- 100 Us Route 1
- 63 Main St
- 1407 U S 1
- 195 River Rd
- 53-04 Race Course Rd
- 53-03 Race Course Rd
- 326 Silver Lake Rd
- 00 Switzer Spring Rd
- 52 State Route 46
- 54 Gross Point Rd
- 4 Switzer Spring Rd
- 291 River Rd