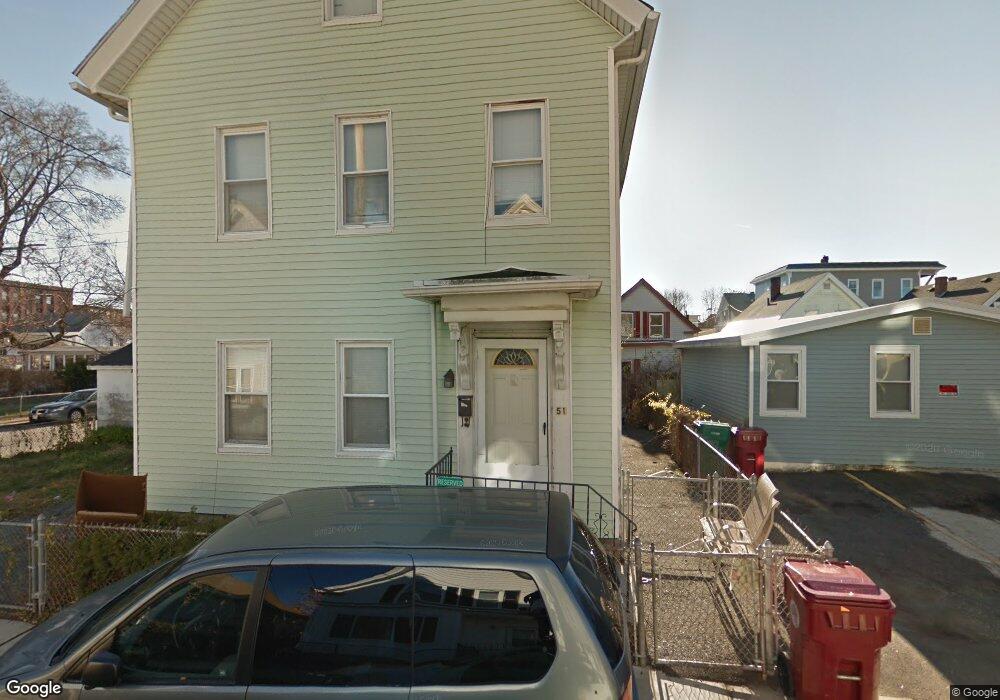
51 Floyd St Lowell, MA 01852
Back Central NeighborhoodEstimated Value: $455,000 - $475,026
--
Bed
2
Baths
2,217
Sq Ft
$211/Sq Ft
Est. Value
About This Home
This home is located at 51 Floyd St, Lowell, MA 01852 and is currently estimated at $466,757, approximately $210 per square foot. 51 Floyd St is a home located in Middlesex County with nearby schools including Moody Elementary School, Abraham Lincoln Elementary School, and Greenhalge Elementary School.
Ownership History
Date
Name
Owned For
Owner Type
Purchase Details
Closed on
Apr 4, 2011
Sold by
Neneh Allie
Bought by
Lowell City Of
Current Estimated Value
Purchase Details
Closed on
Feb 28, 2001
Sold by
Curcio Rosa V
Bought by
Allie Neneh
Home Financials for this Owner
Home Financials are based on the most recent Mortgage that was taken out on this home.
Original Mortgage
$132,102
Interest Rate
7%
Mortgage Type
Purchase Money Mortgage
Create a Home Valuation Report for This Property
The Home Valuation Report is an in-depth analysis detailing your home's value as well as a comparison with similar homes in the area
Home Values in the Area
Average Home Value in this Area
Purchase History
| Date | Buyer | Sale Price | Title Company |
|---|---|---|---|
| Lowell City Of | $843 | -- | |
| Lowell City Of | $843 | -- | |
| Allie Neneh | $137,000 | -- | |
| Allie Neneh | $137,000 | -- |
Source: Public Records
Mortgage History
| Date | Status | Borrower | Loan Amount |
|---|---|---|---|
| Previous Owner | Allie Neneh | $132,102 | |
| Previous Owner | Allie Neneh | $32,000 | |
| Closed | Allie Neneh | $5,000 |
Source: Public Records
Tax History
| Year | Tax Paid | Tax Assessment Tax Assessment Total Assessment is a certain percentage of the fair market value that is determined by local assessors to be the total taxable value of land and additions on the property. | Land | Improvement |
|---|---|---|---|---|
| 2025 | $4,996 | $435,200 | $109,200 | $326,000 |
| 2024 | $4,858 | $407,900 | $98,500 | $309,400 |
| 2023 | $4,607 | $370,900 | $85,600 | $285,300 |
| 2022 | $4,247 | $334,700 | $67,500 | $267,200 |
| 2021 | $3,980 | $295,700 | $58,700 | $237,000 |
| 2020 | $3,666 | $274,400 | $48,900 | $225,500 |
| 2019 | $3,499 | $249,200 | $45,300 | $203,900 |
| 2018 | $3,426 | $238,100 | $43,100 | $195,000 |
| 2017 | $3,409 | $228,500 | $47,100 | $181,400 |
| 2016 | $3,243 | $213,900 | $47,300 | $166,600 |
| 2015 | $3,129 | $202,100 | $47,300 | $154,800 |
| 2013 | $2,736 | $182,300 | $54,600 | $127,700 |
Source: Public Records
Map
Nearby Homes
- 5 Floyd St
- 7 Butler Ave Unit 5
- 8 Cedar Ct
- 31 Merrill St
- 21 Agawam St
- 95 S Highland St
- 810 Lawrence St Unit C
- 8 Cady St
- 39 Moore St
- 39 Groves Ave
- 5 Lenox St Unit 2
- 5 Lenox St Unit 4
- 191 Thorndike St Unit 26
- 201 Thorndike St Unit 501
- 201 Thorndike St Unit 2-312
- 201 Thorndike St Unit 505
- 189 Charles St
- 900 Lawrence St Unit 5
- 88 Perry St
- 158 Concord St
Your Personal Tour Guide
Ask me questions while you tour the home.