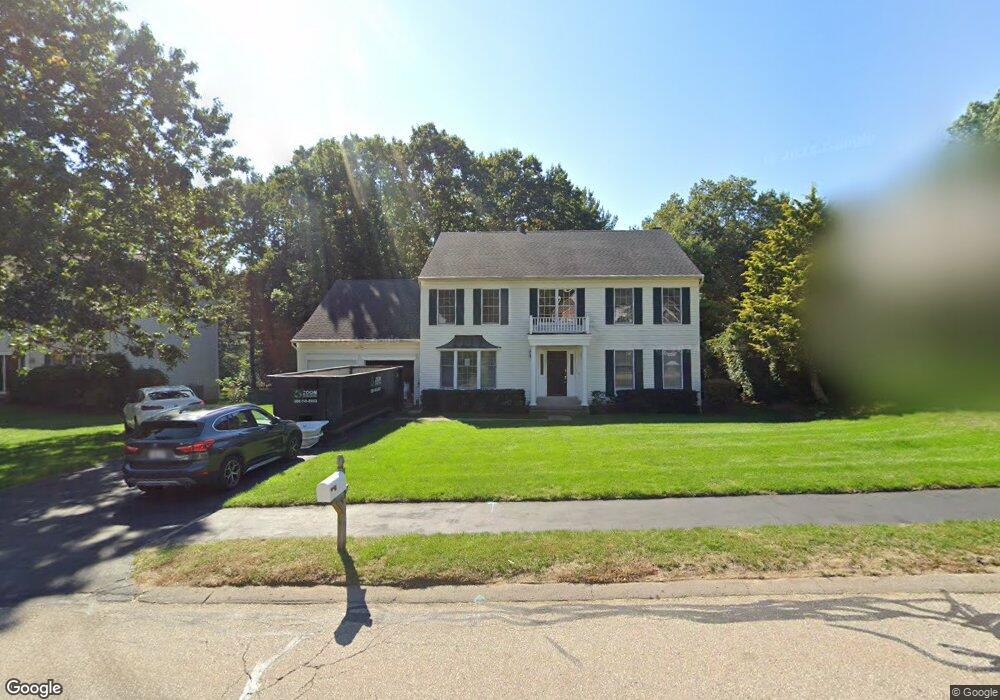
51 Forge Rd Sharon, MA 02067
Estimated Value: $1,099,000 - $1,257,000
4
Beds
3
Baths
3,086
Sq Ft
$386/Sq Ft
Est. Value
About This Home
This home is located at 51 Forge Rd, Sharon, MA 02067 and is currently estimated at $1,190,446, approximately $385 per square foot. 51 Forge Rd is a home located in Norfolk County with nearby schools including Heights Elementary School, Sharon Middle School, and Sharon High School.
Ownership History
Date
Name
Owned For
Owner Type
Purchase Details
Closed on
May 6, 2025
Sold by
Chan Tak S and Chan Siou L
Bought by
Chan Ft and Chan
Current Estimated Value
Purchase Details
Closed on
Jun 17, 2003
Sold by
Borah Julius M and Borah Annabelle
Bought by
Chan Tak Sang and Chan Siou Lin
Home Financials for this Owner
Home Financials are based on the most recent Mortgage that was taken out on this home.
Original Mortgage
$322,700
Interest Rate
5.77%
Mortgage Type
Purchase Money Mortgage
Purchase Details
Closed on
Oct 22, 1993
Sold by
Ma Limited Land Corp
Bought by
Borah Julius M and Borah Annabelle
Create a Home Valuation Report for This Property
The Home Valuation Report is an in-depth analysis detailing your home's value as well as a comparison with similar homes in the area
Home Values in the Area
Average Home Value in this Area
Purchase History
| Date | Buyer | Sale Price | Title Company |
|---|---|---|---|
| Chan Ft | -- | None Available | |
| Chan Ft | -- | None Available | |
| Chan Tak Sang | $593,000 | -- | |
| Chan Tak Sang | $593,000 | -- | |
| Borah Julius M | $286,846 | -- |
Source: Public Records
Mortgage History
| Date | Status | Borrower | Loan Amount |
|---|---|---|---|
| Previous Owner | Chan Tak Sang | $322,700 |
Source: Public Records
Tax History
| Year | Tax Paid | Tax Assessment Tax Assessment Total Assessment is a certain percentage of the fair market value that is determined by local assessors to be the total taxable value of land and additions on the property. | Land | Improvement |
|---|---|---|---|---|
| 2025 | $17,548 | $1,003,900 | $496,400 | $507,500 |
| 2024 | $16,856 | $958,800 | $455,500 | $503,300 |
| 2023 | $15,947 | $857,800 | $419,000 | $438,800 |
| 2022 | $15,168 | $768,000 | $349,100 | $418,900 |
| 2021 | $15,047 | $736,500 | $329,400 | $407,100 |
| 2020 | $13,994 | $736,500 | $329,400 | $407,100 |
| 2019 | $14,022 | $722,400 | $315,300 | $407,100 |
| 2018 | $13,871 | $716,100 | $309,000 | $407,100 |
| 2017 | $13,652 | $695,800 | $288,700 | $407,100 |
| 2016 | $13,275 | $660,100 | $288,700 | $371,400 |
| 2015 | $12,927 | $636,800 | $280,700 | $356,100 |
| 2014 | $11,981 | $583,000 | $255,300 | $327,700 |
Source: Public Records
Map
Nearby Homes
- 6 Balcom Dr
- 63 Forge Rd
- 9 Independence Dr Unit 9
- 1 Maura Elizabeth Ln
- 139 Wolomolopoag St
- 22 Villa Dr
- 24 Eastman Ave
- 2 Foxfire Dr
- 3 Willow St
- 214 Mechanic St
- 165 Chestnut St Unit 2
- 15 Wadsworth Way
- 147 Chestnut St Unit A
- 147 Chestnut St Unit B
- 12 Beach St
- 11 Winter St
- 3 Angela Dr
- 1 Roseland St Unit B-14
- 261 East St
- 98 Mechanic St Unit E
Your Personal Tour Guide
Ask me questions while you tour the home.