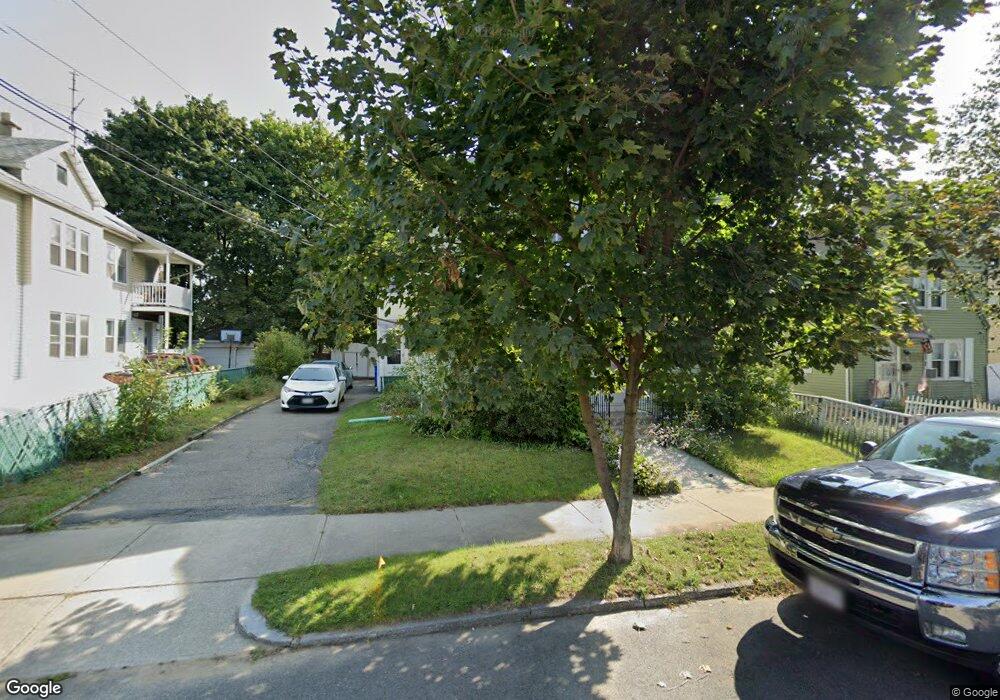
51 Fresno St Unit 53 Springfield, MA 01104
East Springfield NeighborhoodEstimated Value: $235,000 - $381,000
4
Beds
2
Baths
2,050
Sq Ft
$157/Sq Ft
Est. Value
About This Home
This home is located at 51 Fresno St Unit 53, Springfield, MA 01104 and is currently estimated at $321,398, approximately $156 per square foot. 51 Fresno St Unit 53 is a home located in Hampden County with nearby schools including Mary O. Pottenger Elementary School, Van Sickle Academy, and Jeff Davis Co Voc Tech Center.
Ownership History
Date
Name
Owned For
Owner Type
Purchase Details
Closed on
Jun 30, 1999
Sold by
Opitz Edna H
Bought by
Fortier Adelaida Z
Current Estimated Value
Home Financials for this Owner
Home Financials are based on the most recent Mortgage that was taken out on this home.
Original Mortgage
$74,430
Outstanding Balance
$20,240
Interest Rate
7.19%
Mortgage Type
Purchase Money Mortgage
Estimated Equity
$301,158
Create a Home Valuation Report for This Property
The Home Valuation Report is an in-depth analysis detailing your home's value as well as a comparison with similar homes in the area
Home Values in the Area
Average Home Value in this Area
Purchase History
| Date | Buyer | Sale Price | Title Company |
|---|---|---|---|
| Fortier Adelaida Z | $77,000 | -- |
Source: Public Records
Mortgage History
| Date | Status | Borrower | Loan Amount |
|---|---|---|---|
| Open | Fortier Adelaida Z | $74,430 | |
| Previous Owner | Fortier Adelaida Z | $12,000 | |
| Closed | Fortier Adelaida Z | $2,290 |
Source: Public Records
Tax History Compared to Growth
Tax History
| Year | Tax Paid | Tax Assessment Tax Assessment Total Assessment is a certain percentage of the fair market value that is determined by local assessors to be the total taxable value of land and additions on the property. | Land | Improvement |
|---|---|---|---|---|
| 2025 | $4,342 | $276,900 | $37,500 | $239,400 |
| 2024 | $3,713 | $231,200 | $37,500 | $193,700 |
| 2023 | $3,722 | $218,300 | $35,000 | $183,300 |
| 2022 | $3,559 | $189,100 | $32,700 | $156,400 |
| 2021 | $3,343 | $176,900 | $29,700 | $147,200 |
| 2020 | $3,342 | $171,100 | $29,700 | $141,400 |
| 2019 | $2,897 | $147,200 | $30,700 | $116,500 |
| 2018 | $2,739 | $141,100 | $30,700 | $110,400 |
| 2017 | $2,739 | $139,300 | $27,800 | $111,500 |
| 2016 | $2,607 | $132,600 | $27,800 | $104,800 |
| 2015 | $2,596 | $132,000 | $27,800 | $104,200 |
Source: Public Records
Map
Nearby Homes
- 114 Monrovia St
- 58 Eureka St
- 152 Monrovia St
- 16-18 Haumont Terrace
- 223 Saint James Blvd
- 24-26 Jenness St
- 246 El Paso St
- 47 Holy Cross St
- 97 Oklahoma St
- 52-54 Campechi St
- 78 San Miguel St
- 208 Osborne Terrace
- 121 Putnam Cir
- 52&54 Price St
- 25 Victoria St
- 79-81 Windermere St
- 73 Melville
- 74 Woodstock St
- 210 Naismith St
- 36 Chateaugay St