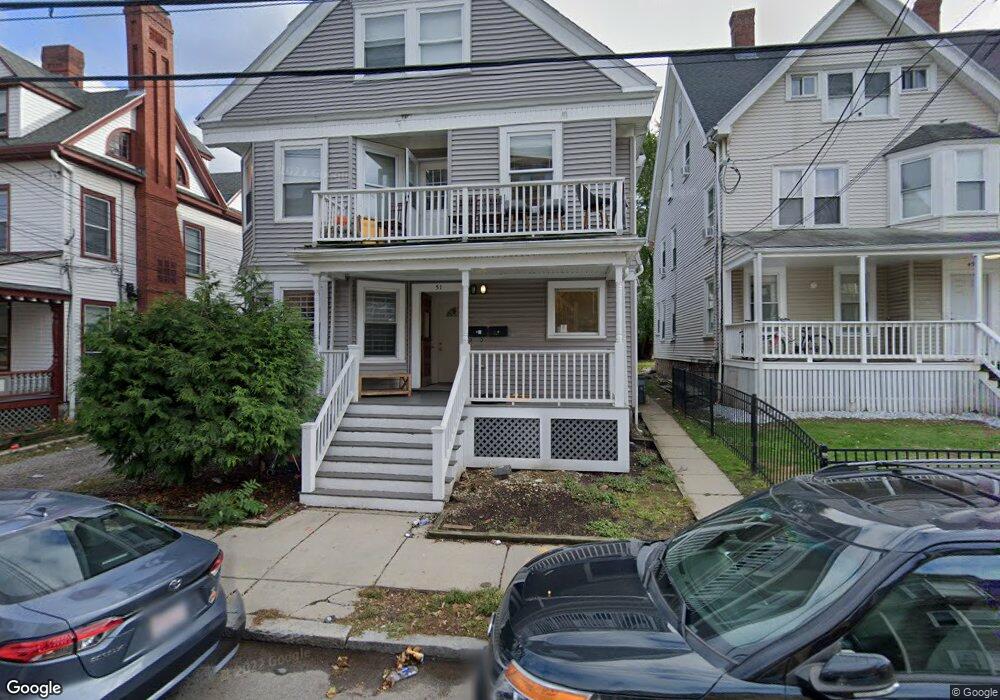
51 Gardner St Allston, MA 02134
Allston NeighborhoodEstimated Value: $1,406,000 - $1,891,055
8
Beds
2
Baths
3,348
Sq Ft
$484/Sq Ft
Est. Value
About This Home
Nicely Renovated 5 Bedroom 2 Full Bathrooms Apartment in Allston.
Packard's Corner Area.
Short Walk to BU and Public Transportation
Big Equal Size Bedrooms
Lots of Closets in Each Bedroom
Eat-in Kitchen
Porch
Recessed Lighting
Lots of Open Space
Laundry Facility is on the Lower Level of the House.
Students Friendly.
Parking is Available for Rent
PROPERTY INFO
Rent: $6000 / Month
Beds: 5
Bath: 2
Available Date: 09/01/2025
Pet: No Pets
FEATURES
Hardwood Floors
Large Bedrooms
Natural Light / Sunny
Open Layout
Recessed Lighting
Remodeled Unit
Skylights
Student Friendly
Ownership History
Date
Name
Owned For
Owner Type
Purchase Details
Closed on
May 9, 2025
Sold by
Jcma Properties Llc
Bought by
51 Gardner Strret Llc
Current Estimated Value
Purchase Details
Closed on
Dec 31, 2012
Sold by
Ciliberti Joseph A
Bought by
Jcma Props Llc
Create a Home Valuation Report for This Property
The Home Valuation Report is an in-depth analysis detailing your home's value as well as a comparison with similar homes in the area
Home Values in the Area
Average Home Value in this Area
Purchase History
| Date | Buyer | Sale Price | Title Company |
|---|---|---|---|
| 51 Gardner Strret Llc | -- | None Available | |
| 51 Gardner Strret Llc | -- | None Available | |
| Jcma Props Llc | -- | -- | |
| Jcma Props Llc | -- | -- |
Source: Public Records
Mortgage History
| Date | Status | Borrower | Loan Amount |
|---|---|---|---|
| Previous Owner | Jcma Props Llc | $255,000 | |
| Previous Owner | Jcma Props Llc | $106,250 |
Source: Public Records
Property History
| Date | Event | Price | List to Sale | Price per Sq Ft |
|---|---|---|---|---|
| 02/10/2025 02/10/25 | Off Market | -- | -- | -- |
| 02/10/2025 02/10/25 | Off Market | $5,500 | -- | -- |
| 01/18/2025 01/18/25 | For Rent | -- | -- | -- |
| 01/17/2025 01/17/25 | For Rent | -- | -- | -- |
| 10/08/2024 10/08/24 | Off Market | $5,500 | -- | -- |
| 09/15/2024 09/15/24 | For Rent | $5,500 | -- | -- |
Tax History
| Year | Tax Paid | Tax Assessment Tax Assessment Total Assessment is a certain percentage of the fair market value that is determined by local assessors to be the total taxable value of land and additions on the property. | Land | Improvement |
|---|---|---|---|---|
| 2025 | $17,023 | $1,470,000 | $530,800 | $939,200 |
| 2024 | $16,499 | $1,513,700 | $501,000 | $1,012,700 |
| 2023 | $16,257 | $1,513,700 | $501,000 | $1,012,700 |
| 2022 | $14,972 | $1,376,100 | $455,500 | $920,600 |
| 2021 | $14,683 | $1,376,100 | $455,500 | $920,600 |
| 2020 | $13,898 | $1,316,100 | $408,200 | $907,900 |
| 2019 | $13,468 | $1,277,800 | $312,300 | $965,500 |
| 2018 | $12,632 | $1,205,300 | $312,300 | $893,000 |
| 2017 | $12,156 | $1,147,900 | $312,300 | $835,600 |
| 2016 | $11,076 | $1,006,900 | $312,300 | $694,600 |
| 2015 | $10,407 | $859,400 | $185,400 | $674,000 |
| 2014 | $9,231 | $733,800 | $185,400 | $548,400 |
Source: Public Records
Map
Nearby Homes
- 59 Brighton Ave Unit 1
- 59 Brighton Ave Unit A
- 57 Brighton Ave Unit C
- 57 Brighton Ave Unit B
- 32 Chester St
- 24 Chester St
- 16-22 Reedsdale St
- 84 Linden St
- 1161 Commonwealth Ave Unit 2
- 56 Park Vale Ave Unit 4
- 18 Glenville Ave Unit 3A
- 4 Franklin St Unit 202
- 4 Franklin St Unit 401
- 1263 Commonwealth Ave Unit 4
- 28 Winslow Rd
- 30 Glenville Ave Unit 1
- 43 Glenville Ave Unit 11
- 116 Thorndike St Unit 1
- 116 Thorndike St Unit 2
- 36 Osborne Rd Unit 1
- 51 Gardner St
- 51 Gardner St Unit 51 Gardner Street
- 51 Gardner St Unit 1
- 51 Gardner St Unit 2
- 51 Gardner St Unit 3
- 51 Gardner St Unit 4
- 51 Gardner St Unit U
- 51 Gardner St Unit 2
- 49 Gardner St Unit Bu
- 49 Gardner St Unit 49
- 49 Gardner St
- 78 Chester St
- 78 Chester St Unit Chester street
- 78 Chester St
- 78 Chester St Unit 36
- 78 Chester St Unit 1
- 78 Chester St Unit 3
- 78 Chester St Unit 203
- 78 Chester St Unit 2
- 53 Gardner St Unit 2
Your Personal Tour Guide
Ask me questions while you tour the home.