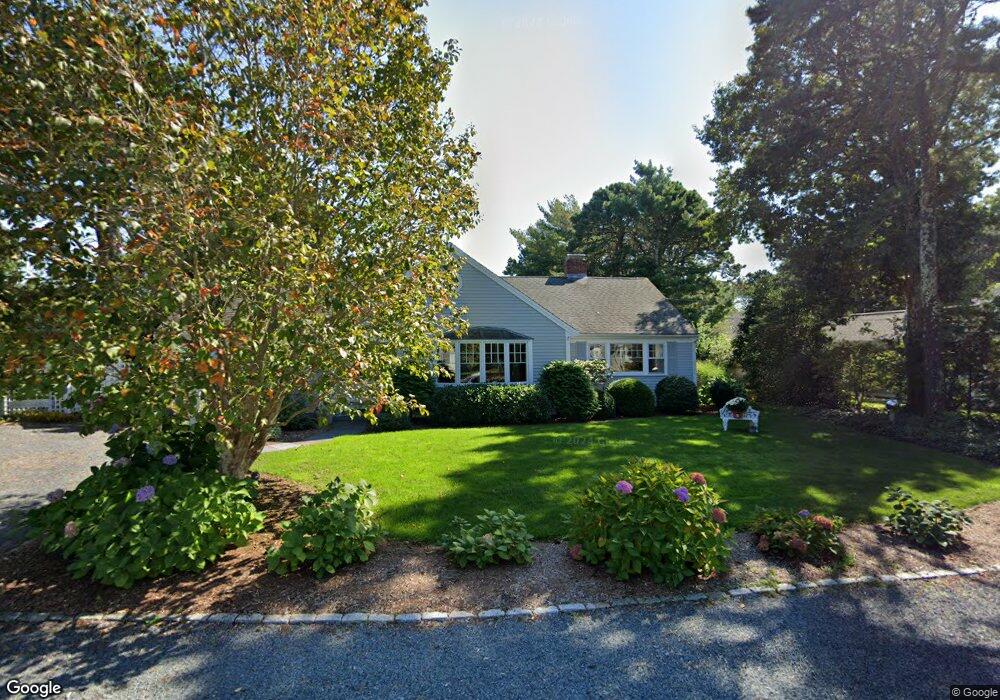
51 Garfield Ln West Dennis, MA 02670
West Dennis NeighborhoodEstimated Value: $931,000 - $1,303,567
2
Beds
1
Bath
1,201
Sq Ft
$1,002/Sq Ft
Est. Value
About This Home
This home is located at 51 Garfield Ln, West Dennis, MA 02670 and is currently estimated at $1,203,642, approximately $1,002 per square foot. 51 Garfield Ln is a home located in Barnstable County with nearby schools including Dennis-Yarmouth Regional High School and St. Pius X. School.
Ownership History
Date
Name
Owned For
Owner Type
Purchase Details
Closed on
Jul 14, 2021
Sold by
Derrico
Bought by
Derrico Robert S and Derrico June C
Current Estimated Value
Home Financials for this Owner
Home Financials are based on the most recent Mortgage that was taken out on this home.
Original Mortgage
$356,000
Outstanding Balance
$321,611
Interest Rate
2.9%
Mortgage Type
New Conventional
Estimated Equity
$882,031
Purchase Details
Closed on
Mar 22, 1996
Sold by
Rhodes Richard A and Rhodes Helen L
Bought by
R&J Rt and Derrico Robert S
Purchase Details
Closed on
Jun 18, 1993
Sold by
Lillian Est Lajeunesse and Lajeunesse Conrad
Bought by
Rhodes Richard A and Rhodes Helen L
Create a Home Valuation Report for This Property
The Home Valuation Report is an in-depth analysis detailing your home's value as well as a comparison with similar homes in the area
Home Values in the Area
Average Home Value in this Area
Purchase History
| Date | Buyer | Sale Price | Title Company |
|---|---|---|---|
| Derrico Robert S | -- | None Available | |
| Derrico Robert S | -- | None Available | |
| R&J Rt | $170,000 | -- | |
| Rhodes Richard A | $165,000 | -- | |
| Derrico | $170,000 | -- | |
| Rhodes Richard A | $165,000 | -- |
Source: Public Records
Mortgage History
| Date | Status | Borrower | Loan Amount |
|---|---|---|---|
| Open | Derrico Robert S | $356,000 | |
| Closed | Derrico Robert S | $356,000 | |
| Previous Owner | Rhodes Richard A | $412,000 | |
| Previous Owner | Rhodes Richard A | $417,000 |
Source: Public Records
Tax History Compared to Growth
Tax History
| Year | Tax Paid | Tax Assessment Tax Assessment Total Assessment is a certain percentage of the fair market value that is determined by local assessors to be the total taxable value of land and additions on the property. | Land | Improvement |
|---|---|---|---|---|
| 2025 | $5,040 | $1,163,900 | $531,600 | $632,300 |
| 2024 | $4,866 | $1,108,400 | $511,200 | $597,200 |
| 2023 | $4,706 | $1,007,800 | $464,700 | $543,100 |
| 2022 | $4,357 | $778,100 | $376,800 | $401,300 |
| 2021 | $4,320 | $716,500 | $369,400 | $347,100 |
| 2020 | $4,142 | $679,000 | $351,800 | $327,200 |
| 2019 | $3,893 | $631,000 | $344,900 | $286,100 |
| 2018 | $3,834 | $604,800 | $328,300 | $276,500 |
| 2017 | $3,720 | $604,800 | $328,300 | $276,500 |
| 2016 | $3,791 | $580,500 | $344,700 | $235,800 |
| 2015 | $3,715 | $580,500 | $344,700 | $235,800 |
| 2014 | $3,466 | $545,800 | $317,400 | $228,400 |
Source: Public Records
Map
Nearby Homes
- 2 Rita Mary Way
- 181 Pleasant St
- 308 Old Main St
- 14 Schoolhouse Ln
- 745 Willow St
- 209 Main St Unit 3
- 209 Main St Unit 6
- 209 Main St Unit 1
- 209 Main St Unit 2
- 209 Main St Unit 4
- 209 Main St Unit 5
- 40 Kelley Rd
- 45 Seth Ln
- 22 Powhatan Rd
- 178 School St
- 17 South St
- 23 Doric Ave
- 29 Bass River Rd
- 15 Sharon Rd
- 9 Victory Ln
- 55 Garfield Ln
- 45 Garfield Ln
- 38 Porter Ln
- 44 Porter Ln
- 64 Garfield Ln
- 60 Garfield Ln
- 37 Garfield Ln
- 61 Garfield Ln
- 70 Garfield Ln
- 32 Porter Ln
- 54 Garfield Ln
- 48 Porter Ln
- 174 Uncle Barneys Rd
- 168 Uncle Barneys Rd
- 33 Garfield Ln
- 48 Garfield Ln
- 33 Porter Ln
- 76 Garfield Ln
- 27 Porter Ln
- 180 Uncle Barneys Rd