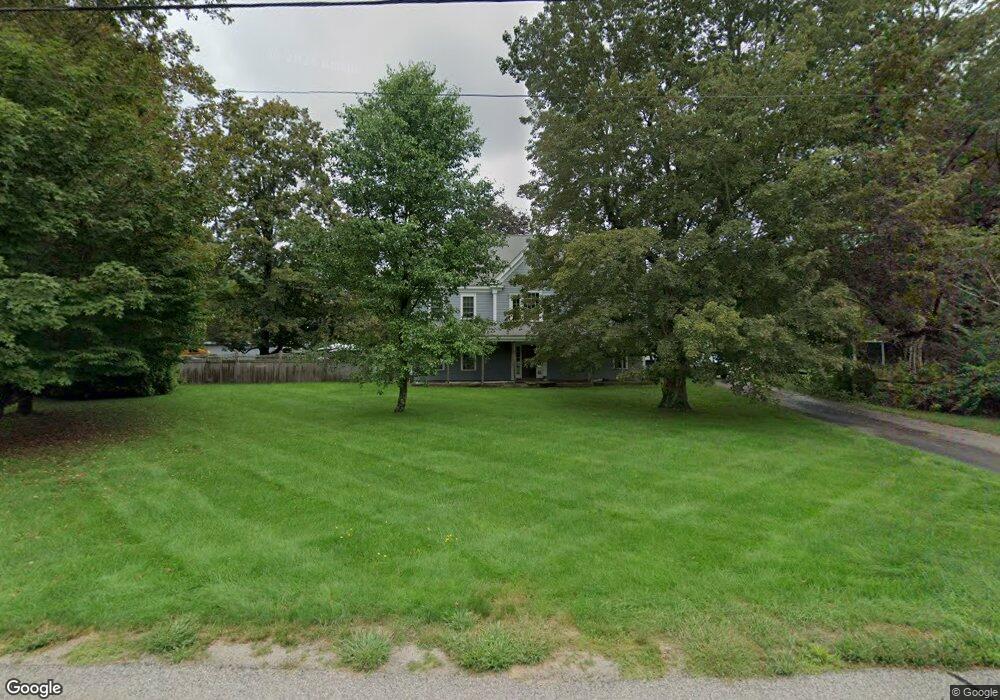
51 Hancock St Wrentham, MA 02093
Sheldonville NeighborhoodEstimated Value: $660,000 - $793,853
3
Beds
3
Baths
2,908
Sq Ft
$251/Sq Ft
Est. Value
About This Home
This home is located at 51 Hancock St, Wrentham, MA 02093 and is currently estimated at $729,463, approximately $250 per square foot. 51 Hancock St is a home located in Norfolk County with nearby schools including Delaney Elementary School, Charles E Roderick, and Mercymount Country Day School.
Ownership History
Date
Name
Owned For
Owner Type
Purchase Details
Closed on
Sep 24, 2001
Sold by
Donaldson Sandra L
Bought by
Parker Raymond and Parker Susan M
Current Estimated Value
Home Financials for this Owner
Home Financials are based on the most recent Mortgage that was taken out on this home.
Original Mortgage
$218,275
Outstanding Balance
$86,002
Interest Rate
6.98%
Mortgage Type
Purchase Money Mortgage
Estimated Equity
$643,461
Create a Home Valuation Report for This Property
The Home Valuation Report is an in-depth analysis detailing your home's value as well as a comparison with similar homes in the area
Home Values in the Area
Average Home Value in this Area
Purchase History
| Date | Buyer | Sale Price | Title Company |
|---|---|---|---|
| Parker Raymond | $220,000 | -- |
Source: Public Records
Mortgage History
| Date | Status | Borrower | Loan Amount |
|---|---|---|---|
| Open | Parker Raymond | $218,275 |
Source: Public Records
Tax History Compared to Growth
Tax History
| Year | Tax Paid | Tax Assessment Tax Assessment Total Assessment is a certain percentage of the fair market value that is determined by local assessors to be the total taxable value of land and additions on the property. | Land | Improvement |
|---|---|---|---|---|
| 2025 | $7,427 | $640,800 | $308,300 | $332,500 |
| 2024 | $7,306 | $608,800 | $308,300 | $300,500 |
| 2023 | $7,087 | $561,600 | $280,100 | $281,500 |
| 2022 | $6,942 | $507,800 | $261,300 | $246,500 |
| 2021 | $6,440 | $457,700 | $228,100 | $229,600 |
| 2020 | $5,905 | $414,400 | $203,100 | $211,300 |
| 2019 | $5,737 | $406,300 | $203,100 | $203,200 |
| 2018 | $6,051 | $424,900 | $203,000 | $221,900 |
| 2017 | $5,748 | $403,400 | $199,100 | $204,300 |
| 2016 | $5,621 | $393,600 | $193,400 | $200,200 |
| 2015 | $5,424 | $362,100 | $185,900 | $176,200 |
| 2014 | $5,385 | $351,700 | $178,800 | $172,900 |
Source: Public Records
Map
Nearby Homes
- 57 Hancock St
- 41 Hancock St
- 58 Hancock St
- 88 Burnt Swamp Rd
- 115 Burnt Swamp Rd
- 46 Hancock St
- 78 Burnt Swamp Rd
- 40 Hancock St
- 125 Burnt Swamp Rd
- 32 Hancock St
- 35 Hancock St
- 112 Hancock St
- 130 Burnt Swamp Rd
- 93 Burnt Swamp Rd
- 63 Burnt Swamp Rd
- 20 Hancock St
- 231 Hancock St
- 4 Mirror Island
- 1043 West St Unit 1
- 1043 West St Unit 1043