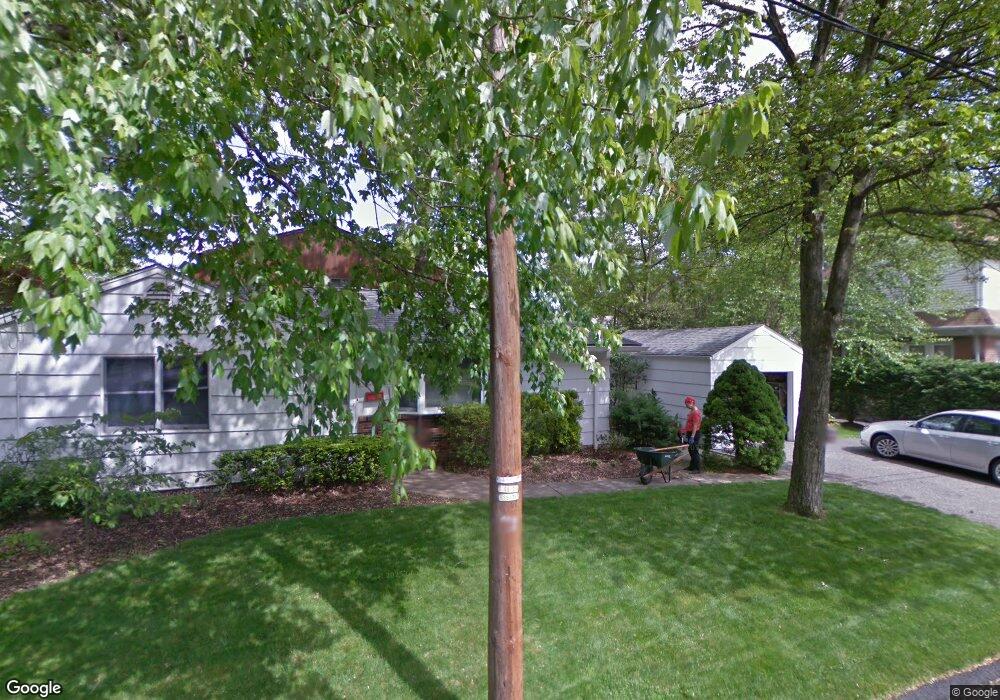
51 Haring St Closter, NJ 07624
Estimated Value: $638,000 - $742,000
2
Beds
2
Baths
820
Sq Ft
$842/Sq Ft
Est. Value
About This Home
This home is located at 51 Haring St, Closter, NJ 07624 and is currently estimated at $690,298, approximately $841 per square foot. 51 Haring St is a home located in Bergen County with nearby schools including Hillside Elementary School, Tenakill Middle School, and Northern Valley Regional High School at Demarest.
Ownership History
Date
Name
Owned For
Owner Type
Purchase Details
Closed on
Sep 11, 2017
Sold by
Bellofatto Steven and Fairweather Charlotte
Bought by
Kim Jung Yeon and Lee Hoisook
Current Estimated Value
Home Financials for this Owner
Home Financials are based on the most recent Mortgage that was taken out on this home.
Original Mortgage
$372,000
Outstanding Balance
$310,646
Interest Rate
3.9%
Mortgage Type
New Conventional
Estimated Equity
$379,652
Purchase Details
Closed on
May 21, 1992
Bought by
Bellofatto Bellofatto S and Bellofatto Fairweather, C
Create a Home Valuation Report for This Property
The Home Valuation Report is an in-depth analysis detailing your home's value as well as a comparison with similar homes in the area
Home Values in the Area
Average Home Value in this Area
Purchase History
| Date | Buyer | Sale Price | Title Company |
|---|---|---|---|
| Kim Jung Yeon | $392,500 | None Available | |
| Bellofatto Bellofatto S | $165,000 | -- |
Source: Public Records
Mortgage History
| Date | Status | Borrower | Loan Amount |
|---|---|---|---|
| Open | Kim Jung Yeon | $372,000 |
Source: Public Records
Tax History
| Year | Tax Paid | Tax Assessment Tax Assessment Total Assessment is a certain percentage of the fair market value that is determined by local assessors to be the total taxable value of land and additions on the property. | Land | Improvement |
|---|---|---|---|---|
| 2025 | $10,131 | $514,100 | $409,200 | $104,900 |
| 2024 | $8,900 | $478,800 | $379,200 | $99,600 |
| 2023 | $8,616 | $415,100 | $318,100 | $97,000 |
| 2022 | $8,616 | $389,500 | $297,200 | $92,300 |
| 2021 | $8,176 | $372,400 | $284,700 | $87,700 |
| 2020 | $8,395 | $374,600 | $286,200 | $88,400 |
| 2019 | $8,176 | $368,800 | $281,700 | $87,100 |
| 2018 | $8,078 | $362,900 | $277,200 | $85,700 |
| 2017 | $7,859 | $344,400 | $264,500 | $79,900 |
| 2016 | $7,711 | $344,400 | $264,500 | $79,900 |
| 2015 | $7,542 | $344,400 | $264,500 | $79,900 |
| 2014 | $7,332 | $344,400 | $264,500 | $79,900 |
Source: Public Records
Map
Nearby Homes
Your Personal Tour Guide
Ask me questions while you tour the home.