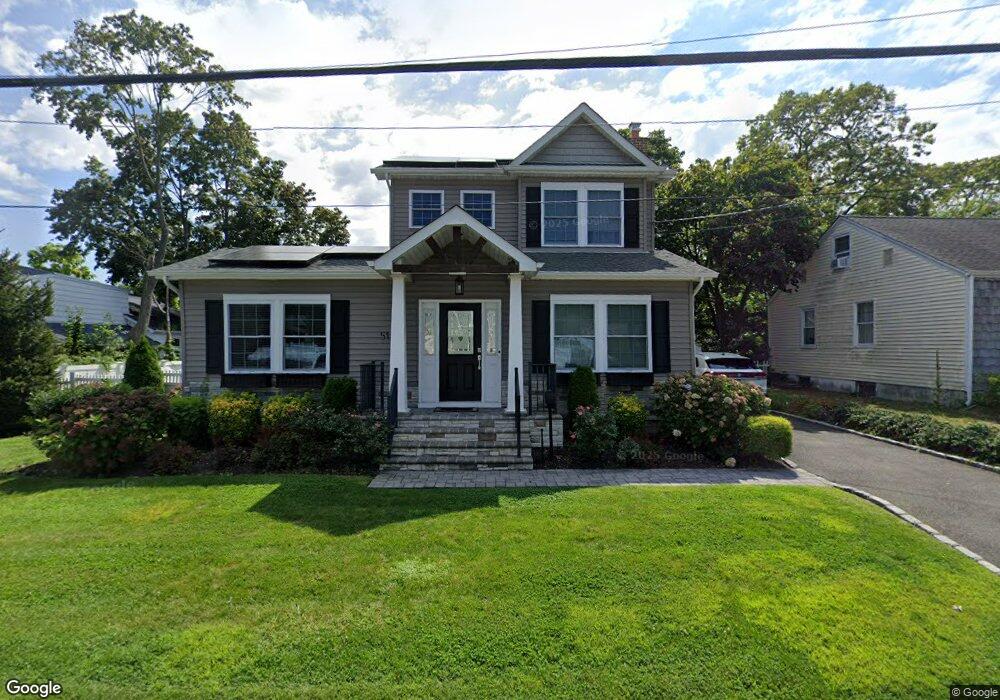
51 Hartford St Lindenhurst, NY 11757
Estimated Value: $584,476 - $782,000
--
Bed
--
Bath
1,719
Sq Ft
$421/Sq Ft
Est. Value
About This Home
This home is located at 51 Hartford St, Lindenhurst, NY 11757 and is currently estimated at $724,369, approximately $421 per square foot. 51 Hartford St is a home located in Suffolk County with nearby schools including Daniel Street School, Lindenhurst Middle School, and Lindenhurst Senior High School.
Ownership History
Date
Name
Owned For
Owner Type
Purchase Details
Closed on
Nov 30, 2018
Sold by
Bayberry Capital Fund 1
Bought by
Manen Brandon V and Valentin Elyse
Current Estimated Value
Home Financials for this Owner
Home Financials are based on the most recent Mortgage that was taken out on this home.
Original Mortgage
$521,977
Outstanding Balance
$452,078
Interest Rate
4.87%
Mortgage Type
FHA
Estimated Equity
$272,291
Purchase Details
Closed on
Apr 11, 2017
Sold by
Spink Edwin and Bruno Anthony
Bought by
Bayberry Capital Fund I Llc
Purchase Details
Closed on
Nov 1, 2015
Sold by
Bruno Anthony and Dykstra Andrea
Bought by
Gehrlein Mary
Create a Home Valuation Report for This Property
The Home Valuation Report is an in-depth analysis detailing your home's value as well as a comparison with similar homes in the area
Home Values in the Area
Average Home Value in this Area
Purchase History
| Date | Buyer | Sale Price | Title Company |
|---|---|---|---|
| Manen Brandon V | $540,000 | -- | |
| Bayberry Capital Fund I Llc | $180,000 | None Available | |
| Gehrlein Mary | -- | None Available |
Source: Public Records
Mortgage History
| Date | Status | Borrower | Loan Amount |
|---|---|---|---|
| Open | Manen Brandon V | $521,977 |
Source: Public Records
Tax History Compared to Growth
Tax History
| Year | Tax Paid | Tax Assessment Tax Assessment Total Assessment is a certain percentage of the fair market value that is determined by local assessors to be the total taxable value of land and additions on the property. | Land | Improvement |
|---|---|---|---|---|
| 2024 | $17,728 | $4,730 | $380 | $4,350 |
| 2023 | $15,731 | $4,730 | $380 | $4,350 |
| 2022 | $9,211 | $4,430 | $380 | $4,050 |
| 2021 | $9,211 | $2,880 | $380 | $2,500 |
| 2020 | $9,146 | $2,880 | $380 | $2,500 |
| 2019 | $10,875 | $0 | $0 | $0 |
| 2018 | $9,133 | $2,880 | $380 | $2,500 |
| 2017 | $9,133 | $2,880 | $380 | $2,500 |
| 2016 | $8,808 | $2,880 | $380 | $2,500 |
| 2015 | -- | $2,880 | $380 | $2,500 |
| 2014 | -- | $2,880 | $380 | $2,500 |
Source: Public Records
Map
Nearby Homes