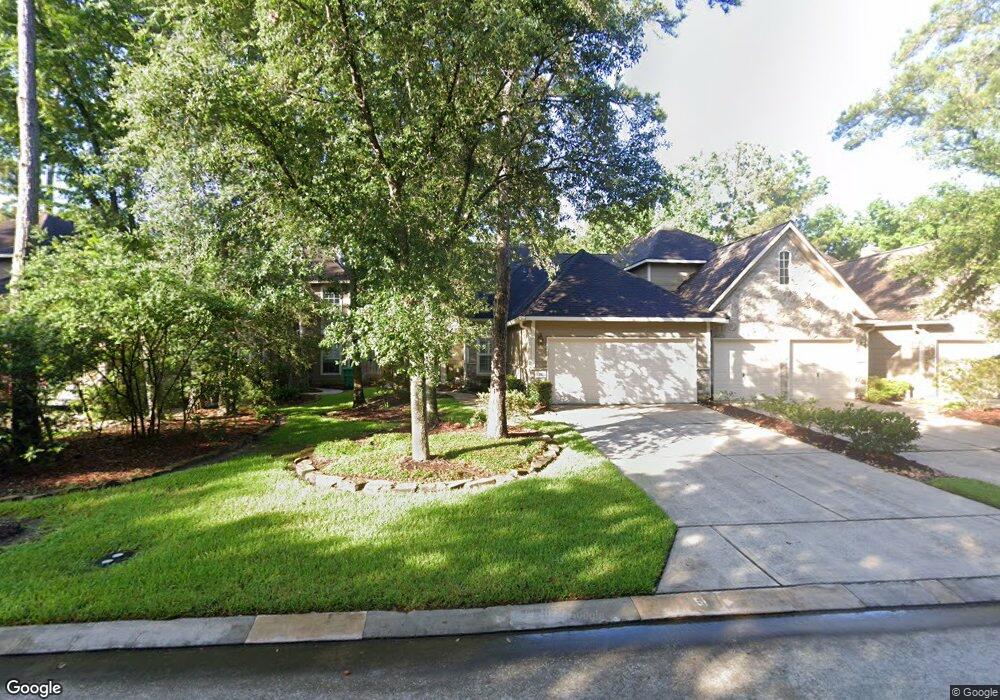
51 Harvest Wind Place Spring, TX 77382
Alden Bridge NeighborhoodEstimated Value: $364,000 - $456,000
3
Beds
3
Baths
2,290
Sq Ft
$177/Sq Ft
Est. Value
About This Home
This home is located at 51 Harvest Wind Place, Spring, TX 77382 and is currently estimated at $404,402, approximately $176 per square foot. 51 Harvest Wind Place is a home located in Montgomery County with nearby schools including Buckalew Elementary School, Mitchell Intermediate School, and McCullough Junior High School.
Ownership History
Date
Name
Owned For
Owner Type
Purchase Details
Closed on
Nov 16, 2012
Sold by
Howe Edward and Howe Constance
Bought by
Brown Kimberly Sue
Current Estimated Value
Home Financials for this Owner
Home Financials are based on the most recent Mortgage that was taken out on this home.
Original Mortgage
$135,000
Outstanding Balance
$93,464
Interest Rate
3.43%
Mortgage Type
New Conventional
Estimated Equity
$310,938
Purchase Details
Closed on
Jan 16, 2009
Sold by
Howe Edward M
Bought by
Howe Constance J
Purchase Details
Closed on
Nov 21, 2007
Sold by
Lynch David T and Lynch Janie W
Bought by
Brown Kimberly Sue
Home Financials for this Owner
Home Financials are based on the most recent Mortgage that was taken out on this home.
Original Mortgage
$103,800
Interest Rate
6.42%
Mortgage Type
Purchase Money Mortgage
Purchase Details
Closed on
Nov 18, 1999
Sold by
Rh Of Texas Ltd Prtnshp
Bought by
Brown Kimberly Sue
Create a Home Valuation Report for This Property
The Home Valuation Report is an in-depth analysis detailing your home's value as well as a comparison with similar homes in the area
Home Values in the Area
Average Home Value in this Area
Purchase History
| Date | Buyer | Sale Price | Title Company |
|---|---|---|---|
| Brown Kimberly Sue | -- | -- | |
| Howe Constance J | -- | American Title Company | |
| Brown Kimberly Sue | -- | -- | |
| Howe Edward M | -- | South Land Title Company Of | |
| Brown Kimberly Sue | -- | -- |
Source: Public Records
Mortgage History
| Date | Status | Borrower | Loan Amount |
|---|---|---|---|
| Open | Brown Kimberly Sue | $135,000 | |
| Previous Owner | Howe Edward M | $103,800 |
Source: Public Records
Tax History Compared to Growth
Tax History
| Year | Tax Paid | Tax Assessment Tax Assessment Total Assessment is a certain percentage of the fair market value that is determined by local assessors to be the total taxable value of land and additions on the property. | Land | Improvement |
|---|---|---|---|---|
| 2025 | $4,906 | $380,969 | -- | -- |
| 2024 | $4,402 | $346,335 | -- | -- |
| 2023 | $4,402 | $314,850 | $50,000 | $371,610 |
| 2022 | $5,802 | $286,230 | $50,000 | $278,220 |
| 2021 | $5,676 | $260,210 | $16,570 | $243,640 |
| 2020 | $5,914 | $255,650 | $16,570 | $239,080 |
| 2019 | $6,034 | $252,800 | $16,570 | $240,550 |
| 2018 | $4,805 | $229,820 | $16,570 | $213,250 |
| 2017 | $5,554 | $229,890 | $16,570 | $213,320 |
| 2016 | $5,583 | $231,070 | $16,570 | $214,500 |
| 2015 | $4,956 | $223,440 | $16,570 | $206,870 |
| 2014 | $4,956 | $211,890 | $16,570 | $201,480 |
Source: Public Records
Map
Nearby Homes
- 70 Harvest Wind Place
- 14 Redland Place
- 78 N Walden Elms Cir
- 15 Redland Place
- 19 Timberstar St
- 35 N Walden Elms Cir
- 309 Gotland Russ Ln
- 26 N Walden Elms Cir
- 406 Thistle Thorn Dr
- 269 Flaxen Chestnut
- 230 S Walden Elms Cir
- 413 New Forest Ln
- 242 Flaxen Chestnut
- 6 Long Springs Place
- 27 S Belfair Place
- 2 Sweet Birch Place
- 30 Lyreleaf Place
- 128 Caspian Way
- 170 Linton Downs Place
- 11 Lyreleaf Place
- 55 Harvest Wind Place
- 47 Harvest Wind Place
- 59 Harvest Wind Place
- 43 Harvest Wind Place
- 63 Harvest Wind Place
- 39 Harvest Wind Place
- 139 N Bethany Bend Cir
- 67 Harvest Wind Place
- 35 Harvest Wind Place
- 50 Harvest Wind Place
- 135 N Bethany Bend Cir
- 54 Harvest Wind Place
- 31 Harvest Wind Place
- 143 N Bethany Bend Cir
- 71 Harvest Wind Place
- 46 Scotch Pine Ct
- 58 Harvest Wind Place
- 131 N Bethany Bend Cir
- 42 Scotch Pine Ct
- 27 Harvest Wind Place