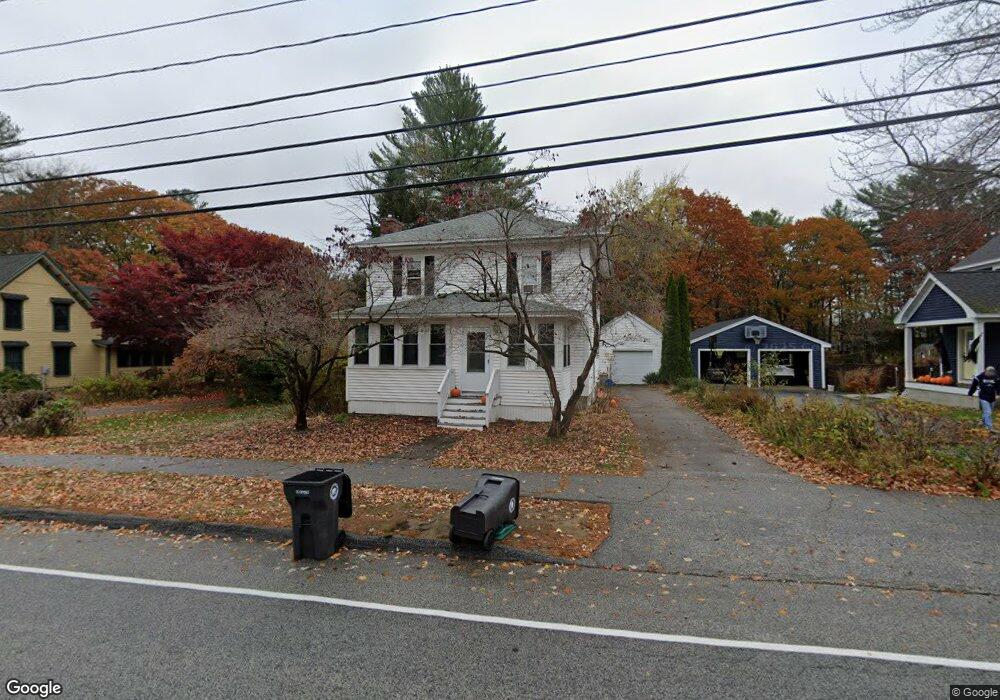
51 High St Kennebunk, ME 04043
Estimated Value: $506,372 - $640,000
4
Beds
2
Baths
1,952
Sq Ft
$293/Sq Ft
Est. Value
About This Home
This home is located at 51 High St, Kennebunk, ME 04043 and is currently estimated at $572,843, approximately $293 per square foot. 51 High St is a home located in York County with nearby schools including Kennebunk High School, School Around Us, and The New School.
Ownership History
Date
Name
Owned For
Owner Type
Purchase Details
Closed on
Jun 1, 2010
Sold by
Anderson James W and Anderson Lee
Bought by
Mcglashan Terence L and Flint Rachel M
Current Estimated Value
Home Financials for this Owner
Home Financials are based on the most recent Mortgage that was taken out on this home.
Original Mortgage
$130,000
Interest Rate
5.13%
Mortgage Type
Purchase Money Mortgage
Create a Home Valuation Report for This Property
The Home Valuation Report is an in-depth analysis detailing your home's value as well as a comparison with similar homes in the area
Home Values in the Area
Average Home Value in this Area
Purchase History
| Date | Buyer | Sale Price | Title Company |
|---|---|---|---|
| Mcglashan Terence L | $250,000 | -- |
Source: Public Records
Mortgage History
| Date | Status | Borrower | Loan Amount |
|---|---|---|---|
| Open | Mcglashan Terence L | $115,000 | |
| Closed | Mcglashan Terence L | $130,000 | |
| Previous Owner | Mcglashan Terence L | $22,275 | |
| Previous Owner | Mcglashan Terence L | $12,000 |
Source: Public Records
Tax History
| Year | Tax Paid | Tax Assessment Tax Assessment Total Assessment is a certain percentage of the fair market value that is determined by local assessors to be the total taxable value of land and additions on the property. | Land | Improvement |
|---|---|---|---|---|
| 2024 | $4,334 | $255,700 | $87,300 | $168,400 |
| 2023 | $4,104 | $255,700 | $87,300 | $168,400 |
| 2022 | $3,733 | $255,700 | $87,300 | $168,400 |
| 2021 | $3,644 | $255,700 | $87,300 | $168,400 |
| 2020 | $3,618 | $255,700 | $87,300 | $168,400 |
| 2019 | $3,516 | $255,700 | $87,300 | $168,400 |
| 2018 | $1,744 | $191,800 | $65,500 | $126,300 |
| 2017 | $3,174 | $191,800 | $65,500 | $126,300 |
| 2016 | $3,050 | $191,800 | $65,500 | $126,300 |
| 2015 | $2,935 | $191,800 | $65,500 | $126,300 |
| 2014 | $2,858 | $191,800 | $65,500 | $126,300 |
Source: Public Records
Map
Nearby Homes
- 24 Cat Mousam Rd
- 17 Legacy Ln
- 30 York St Unit 1
- Lot 2 Creekside Ct Unit 2
- 59 Plymouth Grove Unit 11
- 60 Brown St Unit 2
- 61 Fletcher St
- 4 Cider Mill Ln
- 14 Lawrence Ln
- 15 Casey Ln
- 22 Winchester Ct
- 16 Oakwood Ln Unit 16
- 17 Hampton Glen Dr Unit 5
- 22 Oakwood Ln
- 6 Dunnhill Dr Unit 28
- 056 Cat Mousam Rd
- 4 Conservation Dr
- 23 Lilac Ln
- 19 Old Alewive Rd
- 18 Longwood Dr
Your Personal Tour Guide
Ask me questions while you tour the home.