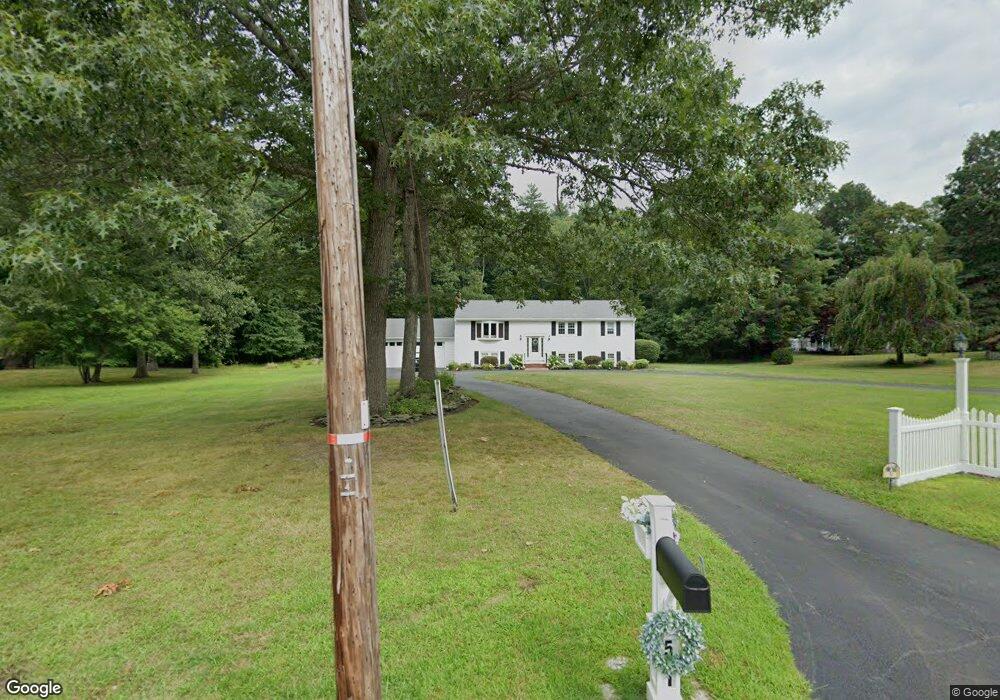
51 Indian Path Hanson, MA 02341
Estimated Value: $613,000 - $706,000
3
Beds
1
Bath
1,344
Sq Ft
$486/Sq Ft
Est. Value
About This Home
This home is located at 51 Indian Path, Hanson, MA 02341 and is currently estimated at $653,141, approximately $485 per square foot. 51 Indian Path is a home located in Plymouth County.
Ownership History
Date
Name
Owned For
Owner Type
Purchase Details
Closed on
Jun 27, 2013
Sold by
Hulak Michael T and Hulak Marie E
Bought by
Hulak Casey Ft and Hulak
Current Estimated Value
Purchase Details
Closed on
Jun 24, 2013
Sold by
Hulak Casey Ft and Hulak
Bought by
Hulak Michael T and Hulak Marie E
Purchase Details
Closed on
Oct 25, 2012
Sold by
Hulak Michael T and Hulak Marie E
Bought by
Hulak Casey Ft and Hulak
Purchase Details
Closed on
Aug 10, 2011
Sold by
Hulak Marie E
Bought by
Hulak Michael T and Hulak Marie E
Home Financials for this Owner
Home Financials are based on the most recent Mortgage that was taken out on this home.
Original Mortgage
$113,000
Interest Rate
4%
Mortgage Type
Purchase Money Mortgage
Create a Home Valuation Report for This Property
The Home Valuation Report is an in-depth analysis detailing your home's value as well as a comparison with similar homes in the area
Home Values in the Area
Average Home Value in this Area
Purchase History
| Date | Buyer | Sale Price | Title Company |
|---|---|---|---|
| Hulak Casey Ft | -- | -- | |
| Hulak Michael T | -- | -- | |
| Hulak Casey Ft | -- | -- | |
| Hulak Michael T | -- | -- | |
| Hulak Michael T | -- | -- | |
| Hulak Casey Ft | -- | -- | |
| Hulak Michael T | -- | -- | |
| Hulak Casey Ft | -- | -- | |
| Hulak Michael T | -- | -- |
Source: Public Records
Mortgage History
| Date | Status | Borrower | Loan Amount |
|---|---|---|---|
| Previous Owner | Hulak Michael T | $113,000 |
Source: Public Records
Tax History
| Year | Tax Paid | Tax Assessment Tax Assessment Total Assessment is a certain percentage of the fair market value that is determined by local assessors to be the total taxable value of land and additions on the property. | Land | Improvement |
|---|---|---|---|---|
| 2025 | $7,177 | $536,400 | $182,900 | $353,500 |
| 2024 | $6,971 | $521,000 | $177,700 | $343,300 |
| 2023 | $6,818 | $480,800 | $177,700 | $303,100 |
| 2022 | $6,597 | $437,200 | $161,500 | $275,700 |
| 2021 | $6,019 | $398,600 | $155,300 | $243,300 |
| 2020 | $5,882 | $385,200 | $150,000 | $235,200 |
| 2019 | $5,487 | $353,300 | $147,100 | $206,200 |
| 2018 | $5,425 | $342,700 | $141,500 | $201,200 |
| 2017 | $5,259 | $329,100 | $134,700 | $194,400 |
| 2016 | $5,306 | $320,600 | $134,700 | $185,900 |
| 2015 | $5,032 | $316,100 | $134,700 | $181,400 |
Source: Public Records
Map
Nearby Homes
- Lot 6 Way
- Lot 2 Harvard Rd
- 134 Crescent St
- 161 Winter St Unit 11
- 269 Lakeside Rd
- 361 County Rd
- 361A County Rd
- 38 High St Unit 8
- 1054 Main St
- 84 Liberty St
- 72 Phillips St
- Lot 5 Princeton Way
- 501 W Washington St
- 430 Brook Bend Rd
- 61 Sawmill Ln
- 61 Sawmill Ln Unit 61
- 139 Fairwood Dr
- 66 Wildwood Rd
- 143 Plymouth St
- 339 State St
- 62 Indian Path
- 31 Indian Path
- 23 Indian Path
- 48 Indian Path
- 56 Indian Path
- 671 Indian Head St
- 24 Indian Path
- 651 Indian Head St
- 685 Indian Head St
- 11 Indian Path
- 631 Indian Head St
- 26 Indian Trail
- 8 Indian Path
- 617 Indian Head St
- 40 Indian Trail
- 607 Indian Head St
- 636 Indian Head St
- 116 Indian Trail
- 680 Indian Head St
- 658 Indian Head St
Your Personal Tour Guide
Ask me questions while you tour the home.