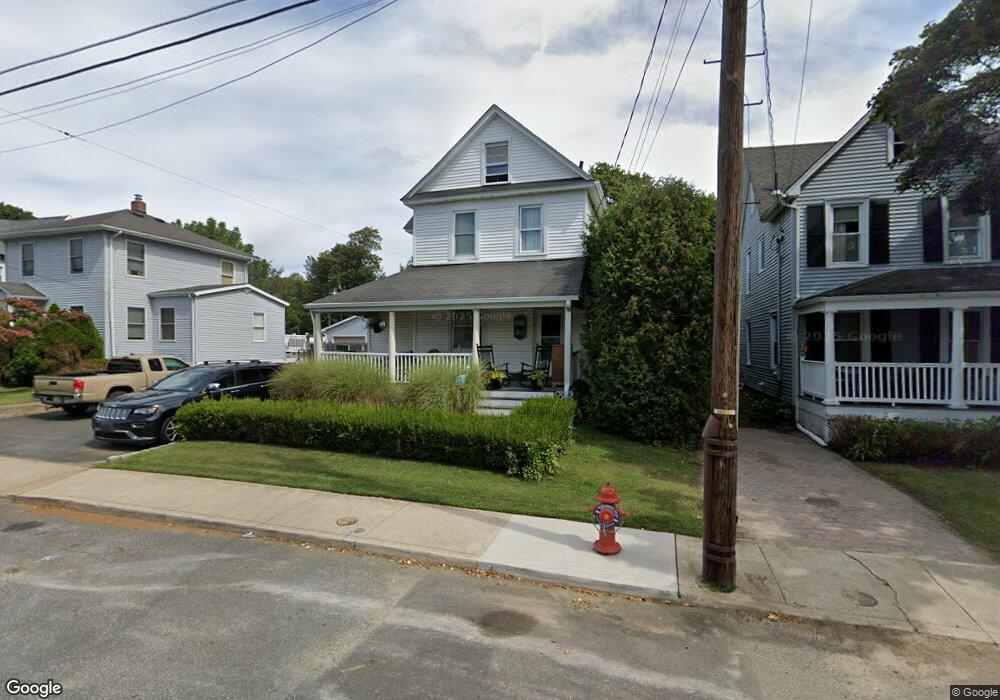
51 Jackson St Long Branch, NJ 07740
Estimated Value: $619,000 - $730,000
--
Bed
2
Baths
2,211
Sq Ft
$293/Sq Ft
Est. Value
About This Home
This home is located at 51 Jackson St, Long Branch, NJ 07740 and is currently estimated at $648,735, approximately $293 per square foot. 51 Jackson St is a home located in Monmouth County with nearby schools including Long Branch High School and Holy Trinity School.
Ownership History
Date
Name
Owned For
Owner Type
Purchase Details
Closed on
Sep 27, 2008
Sold by
Arnold David C and Arnold Karyn A
Bought by
Arnold Karyn A
Current Estimated Value
Home Financials for this Owner
Home Financials are based on the most recent Mortgage that was taken out on this home.
Original Mortgage
$230,000
Outstanding Balance
$151,064
Interest Rate
6.43%
Mortgage Type
New Conventional
Estimated Equity
$497,671
Purchase Details
Closed on
Jul 18, 1995
Sold by
Thompson Leroy
Bought by
Arnold David and Arnold Karyn
Home Financials for this Owner
Home Financials are based on the most recent Mortgage that was taken out on this home.
Original Mortgage
$44,000
Interest Rate
7.49%
Create a Home Valuation Report for This Property
The Home Valuation Report is an in-depth analysis detailing your home's value as well as a comparison with similar homes in the area
Home Values in the Area
Average Home Value in this Area
Purchase History
| Date | Buyer | Sale Price | Title Company |
|---|---|---|---|
| Arnold Karyn A | -- | None Available | |
| Arnold David | $45,100 | -- |
Source: Public Records
Mortgage History
| Date | Status | Borrower | Loan Amount |
|---|---|---|---|
| Open | Arnold Karyn A | $230,000 | |
| Closed | Arnold David | $44,000 |
Source: Public Records
Tax History
| Year | Tax Paid | Tax Assessment Tax Assessment Total Assessment is a certain percentage of the fair market value that is determined by local assessors to be the total taxable value of land and additions on the property. | Land | Improvement |
|---|---|---|---|---|
| 2025 | $7,302 | $504,500 | $208,700 | $295,800 |
| 2024 | $6,706 | $475,100 | $183,700 | $291,400 |
| 2023 | $6,706 | $431,800 | $153,700 | $278,100 |
| 2022 | $6,946 | $388,700 | $143,700 | $245,000 |
| 2021 | $6,946 | $347,800 | $118,700 | $229,100 |
| 2020 | $6,949 | $332,500 | $104,700 | $227,800 |
| 2019 | $6,598 | $313,900 | $96,700 | $217,200 |
| 2018 | $7,395 | $349,800 | $89,700 | $260,100 |
| 2017 | $7,088 | $343,900 | $88,700 | $255,200 |
| 2016 | $6,918 | $342,300 | $93,700 | $248,600 |
| 2015 | $6,512 | $292,400 | $92,100 | $200,300 |
| 2014 | $5,940 | $281,100 | $103,300 | $177,800 |
Source: Public Records
Map
Nearby Homes
- 631 Irving Place
- 681 Morford Ave
- 75 Washington St
- 10 Grace Ct
- 75 Pearl St
- 28 Morrell St
- 88 Norwood Ave
- 7 Linden Ave
- 657 Campbell Ave
- 395 Broadway
- 940 Broadway
- 554 Winter St
- 638 Overton Place
- 516 Atlantic Ave
- 25 Community Place
- 401 Joline Ave
- 14 Slocum Place
- 134 Lippincott Ave
- 38 Hilltop Rd
- 274 Bath Ave
Your Personal Tour Guide
Ask me questions while you tour the home.