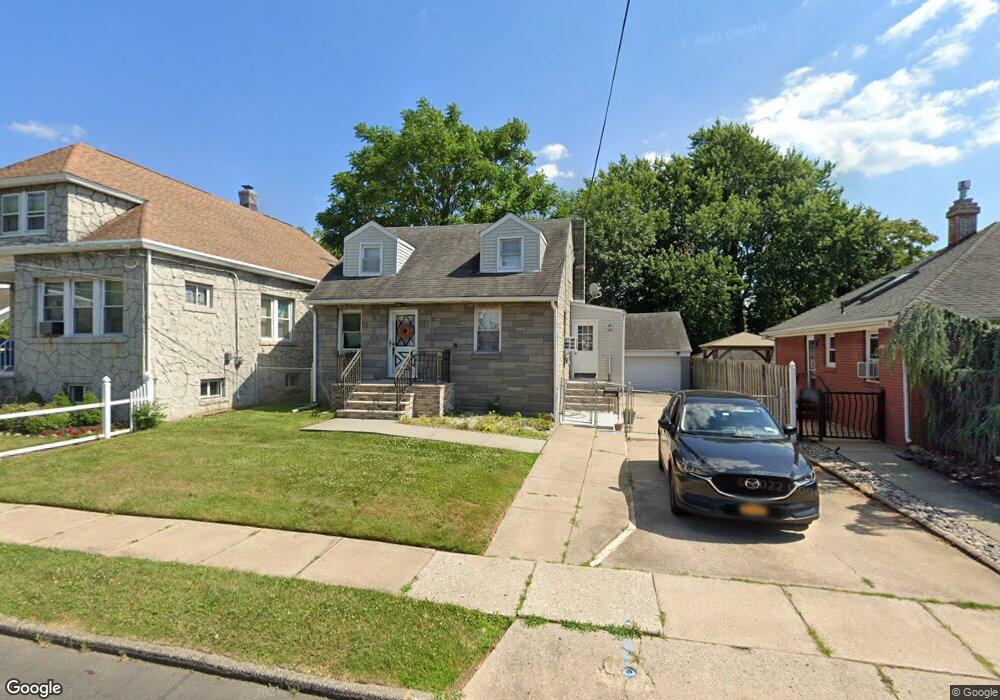
51 James St Perth Amboy, NJ 08861
Estimated Value: $340,614 - $514,000
3
Beds
1
Bath
806
Sq Ft
$531/Sq Ft
Est. Value
About This Home
This home is located at 51 James St, Perth Amboy, NJ 08861 and is currently estimated at $427,904, approximately $530 per square foot. 51 James St is a home located in Middlesex County with nearby schools including Port Reading Elementary School, Fords Middle School, and John F. Kennedy Memorial High School.
Ownership History
Date
Name
Owned For
Owner Type
Purchase Details
Closed on
Apr 11, 2007
Sold by
Perez Manuel
Bought by
Williams Arnold and Williams Sabrina Burnett
Current Estimated Value
Home Financials for this Owner
Home Financials are based on the most recent Mortgage that was taken out on this home.
Original Mortgage
$259,921
Outstanding Balance
$157,414
Interest Rate
6.18%
Mortgage Type
FHA
Estimated Equity
$270,490
Purchase Details
Closed on
Mar 15, 2004
Sold by
Cannella Peter A
Bought by
Perez Manuel and Perez Tracy
Create a Home Valuation Report for This Property
The Home Valuation Report is an in-depth analysis detailing your home's value as well as a comparison with similar homes in the area
Home Values in the Area
Average Home Value in this Area
Purchase History
| Date | Buyer | Sale Price | Title Company |
|---|---|---|---|
| Williams Arnold | $264,000 | -- | |
| Perez Manuel | $219,000 | -- |
Source: Public Records
Mortgage History
| Date | Status | Borrower | Loan Amount |
|---|---|---|---|
| Open | Williams Arnold | $259,921 |
Source: Public Records
Tax History
| Year | Tax Paid | Tax Assessment Tax Assessment Total Assessment is a certain percentage of the fair market value that is determined by local assessors to be the total taxable value of land and additions on the property. | Land | Improvement |
|---|---|---|---|---|
| 2025 | $7,233 | $57,000 | $20,000 | $37,000 |
| 2024 | $7,051 | $57,000 | $20,000 | $37,000 |
Source: Public Records
Map
Nearby Homes
Your Personal Tour Guide
Ask me questions while you tour the home.