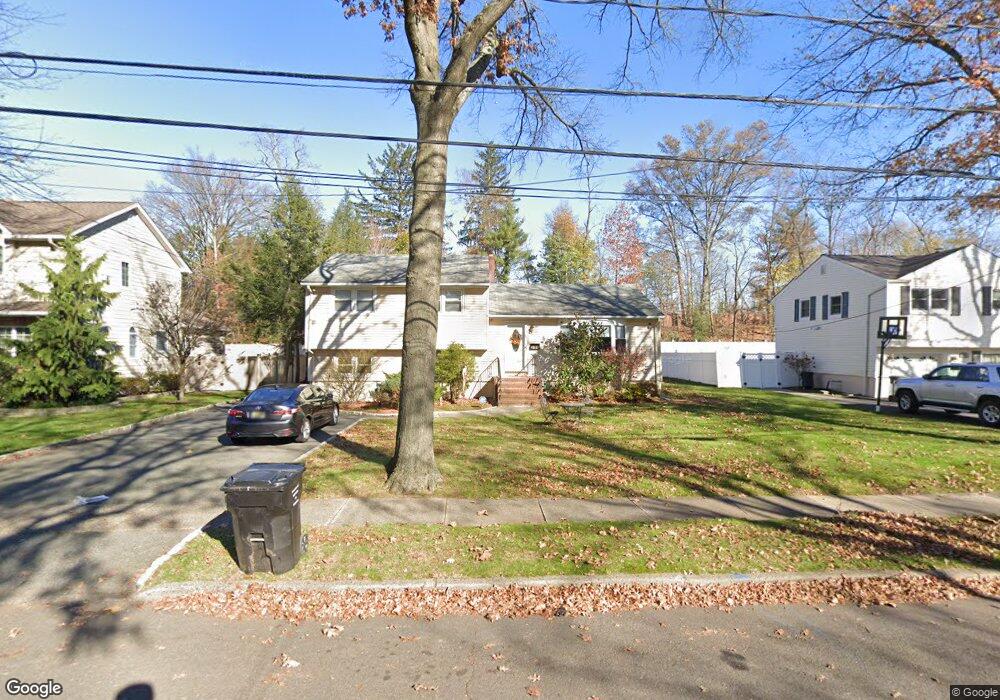
51 Jay Dr Paramus, NJ 07652
Estimated Value: $885,489 - $982,000
4
Beds
3
Baths
1,752
Sq Ft
$524/Sq Ft
Est. Value
About This Home
This home is located at 51 Jay Dr, Paramus, NJ 07652 and is currently estimated at $917,622, approximately $523 per square foot. 51 Jay Dr is a home located in Bergen County with nearby schools including Paramus High School, Alpine Learning Group, and Little Crane Montessori School.
Ownership History
Date
Name
Owned For
Owner Type
Purchase Details
Closed on
Feb 22, 2016
Sold by
Lee Seongbok and Lee Hyeyoung
Bought by
Joshi Vikrant S and Joshi Kavita
Current Estimated Value
Home Financials for this Owner
Home Financials are based on the most recent Mortgage that was taken out on this home.
Original Mortgage
$400,000
Outstanding Balance
$166,883
Interest Rate
3.19%
Mortgage Type
New Conventional
Estimated Equity
$750,739
Purchase Details
Closed on
Feb 12, 2004
Sold by
Garcia Celio Lemos
Bought by
Lee Seongbok and Lee Hyeyoung
Home Financials for this Owner
Home Financials are based on the most recent Mortgage that was taken out on this home.
Original Mortgage
$320,000
Interest Rate
5.62%
Purchase Details
Closed on
Oct 31, 1996
Sold by
Mirsky Irving and Mirsky Eileen
Bought by
Garcia Celio Lemos and Garcia Suleide Macedo
Create a Home Valuation Report for This Property
The Home Valuation Report is an in-depth analysis detailing your home's value as well as a comparison with similar homes in the area
Home Values in the Area
Average Home Value in this Area
Purchase History
| Date | Buyer | Sale Price | Title Company |
|---|---|---|---|
| Joshi Vikrant S | $546,000 | Spring Valley Title Agency | |
| Lee Seongbok | $450,000 | -- | |
| Garcia Celio Lemos | $253,000 | -- |
Source: Public Records
Mortgage History
| Date | Status | Borrower | Loan Amount |
|---|---|---|---|
| Open | Joshi Vikrant S | $400,000 | |
| Previous Owner | Lee Seongbok | $320,000 |
Source: Public Records
Tax History
| Year | Tax Paid | Tax Assessment Tax Assessment Total Assessment is a certain percentage of the fair market value that is determined by local assessors to be the total taxable value of land and additions on the property. | Land | Improvement |
|---|---|---|---|---|
| 2025 | $9,761 | $688,300 | $369,700 | $318,600 |
| 2024 | $9,472 | $644,700 | $341,300 | $303,400 |
| 2023 | $8,969 | $617,500 | $324,800 | $292,700 |
| 2022 | $8,969 | $577,900 | $302,300 | $275,600 |
| 2021 | $8,806 | $532,400 | $278,700 | $253,700 |
| 2020 | $8,363 | $524,300 | $274,000 | $250,300 |
| 2019 | $7,814 | $421,000 | $281,700 | $139,300 |
| 2018 | $7,717 | $421,000 | $281,700 | $139,300 |
| 2017 | $7,582 | $421,000 | $281,700 | $139,300 |
| 2016 | $7,376 | $421,000 | $281,700 | $139,300 |
| 2015 | $7,300 | $421,000 | $281,700 | $139,300 |
| 2014 | $7,237 | $421,000 | $281,700 | $139,300 |
Source: Public Records
Map
Nearby Homes
- 18 Vermont Dr
- 101 Glen Ave
- 683 Eastern Ct
- 947 E Glen Ave
- 779 Decker Place
- 33 Oliver Rd
- 133 Morristown Place
- 1153 Linwood Ave
- 65 Edgewood Dr
- 780 Hilton Place
- 615 Shelton Rd
- 648 Falmouth Ave
- 83 Hampshire Rd
- 643 Spring Ave
- 86 Azalea St
- 82 Azalea St
- 778 E Ridgewood Ave
- 605 Craig Ave
- 80 Ridgewood Rd Unit 106
- 163 Hampton Place
Your Personal Tour Guide
Ask me questions while you tour the home.