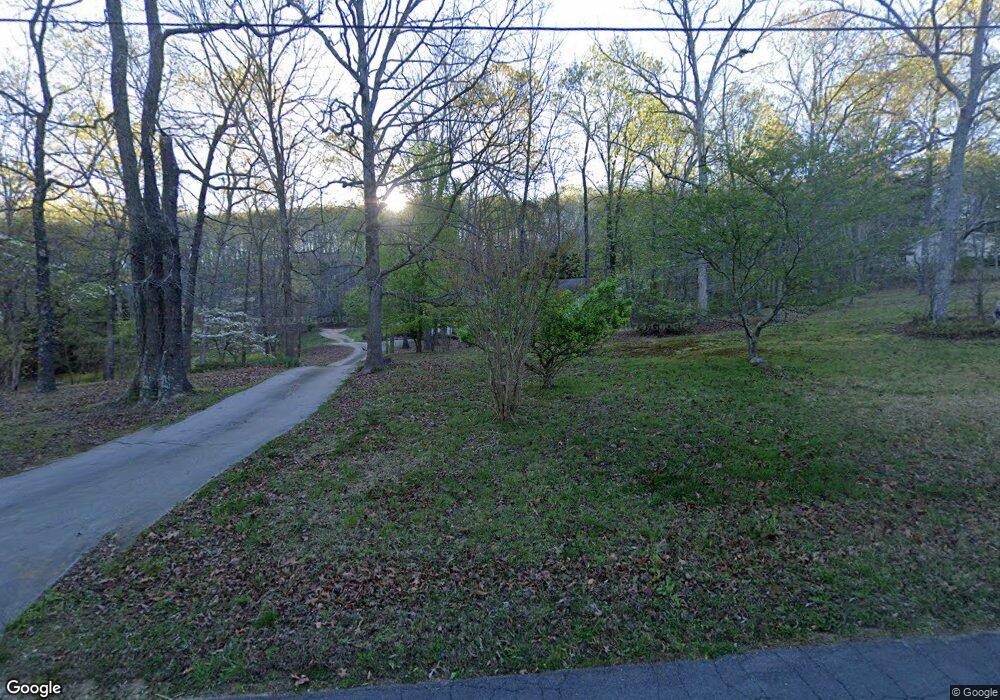
51 John Ingram Rd SE Silver Creek, GA 30173
Estimated Value: $314,000 - $398,806
--
Bed
--
Bath
2,424
Sq Ft
$147/Sq Ft
Est. Value
About This Home
This home is located at 51 John Ingram Rd SE, Silver Creek, GA 30173 and is currently estimated at $356,202, approximately $146 per square foot. 51 John Ingram Rd SE is a home located in Floyd County with nearby schools including Pepperell Middle School and Pepperell High School.
Ownership History
Date
Name
Owned For
Owner Type
Purchase Details
Closed on
Sep 4, 2009
Sold by
Smith Mallory G
Bought by
Umphrey James L
Current Estimated Value
Home Financials for this Owner
Home Financials are based on the most recent Mortgage that was taken out on this home.
Original Mortgage
$130,240
Interest Rate
5.15%
Mortgage Type
FHA
Purchase Details
Closed on
May 18, 2007
Sold by
Not Provided
Bought by
Umphrey James L
Purchase Details
Closed on
Jun 23, 1995
Sold by
Canada Harry L
Bought by
Smith Mallory G and Smith Dianne P
Purchase Details
Closed on
Dec 4, 1986
Sold by
Allen Emmett R
Bought by
Canada Harry L
Purchase Details
Closed on
Jan 2, 1980
Sold by
Canada Harry L and Canada Debaroh
Bought by
Allen Emmett R
Purchase Details
Closed on
Oct 24, 1978
Sold by
Partnership Properties Inc
Bought by
Canada Harry L and Canada Debaroh
Purchase Details
Closed on
Mar 22, 1978
Sold by
Allen Emmett R
Bought by
Partnership Properties Inc
Purchase Details
Closed on
Jan 2, 1977
Sold by
Cooper & Black Partnership Properties
Bought by
Allen Emmett R
Purchase Details
Closed on
Jan 1, 1977
Bought by
Cooper & Black Partnership Properties
Create a Home Valuation Report for This Property
The Home Valuation Report is an in-depth analysis detailing your home's value as well as a comparison with similar homes in the area
Home Values in the Area
Average Home Value in this Area
Purchase History
| Date | Buyer | Sale Price | Title Company |
|---|---|---|---|
| Umphrey James L | $145,200 | -- | |
| Umphrey James L | -- | -- | |
| Smith Mallory G | $75,000 | -- | |
| Canada Harry L | -- | -- | |
| Allen Emmett R | $2,200 | -- | |
| Canada Harry L | -- | -- | |
| Partnership Properties Inc | $4,500 | -- | |
| Allen Emmett R | $6,800 | -- | |
| Cooper & Black Partnership Properties | -- | -- |
Source: Public Records
Mortgage History
| Date | Status | Borrower | Loan Amount |
|---|---|---|---|
| Open | Umphrey James L | $179,948 | |
| Closed | Umphrey James L | $130,240 |
Source: Public Records
Tax History Compared to Growth
Tax History
| Year | Tax Paid | Tax Assessment Tax Assessment Total Assessment is a certain percentage of the fair market value that is determined by local assessors to be the total taxable value of land and additions on the property. | Land | Improvement |
|---|---|---|---|---|
| 2024 | $2,751 | $121,800 | $16,056 | $105,744 |
| 2023 | $2,742 | $118,196 | $14,596 | $103,600 |
| 2022 | $2,350 | $94,487 | $12,075 | $82,412 |
| 2021 | $2,044 | $76,784 | $10,926 | $65,858 |
| 2020 | $1,992 | $73,302 | $9,501 | $63,801 |
| 2019 | $1,930 | $71,146 | $9,501 | $61,645 |
| 2018 | $1,786 | $63,155 | $9,049 | $54,106 |
| 2017 | $1,759 | $61,514 | $8,378 | $53,136 |
| 2016 | $1,710 | $59,200 | $8,360 | $50,840 |
| 2015 | $1,590 | $59,920 | $8,360 | $51,560 |
| 2014 | $1,590 | $60,680 | $8,360 | $52,320 |
Source: Public Records
Map
Nearby Homes
- 12 Indian River Rd SE
- 22 Timberwood Dr SE
- 16 Timberwood Dr SE
- 7 Timberwood Dr SE
- 62 Ramblewood Dr SE
- 0 Wedgewood Dr
- 550 Donahoo Rd SE
- 1380 Old Cedartown Rd SE
- 23 Rainwood Cir SE
- Lot 54 Ridgeview Dr SE
- 13 Rainwood Dr SE
- 37 Ramblewood Dr SE
- 81 Hughes Dairy Rd
- 1531 Old Rockmart Rd SE
- 504 Rockmart Rd SE
- 184 Conns Lake Extension
- 290 Donahoo Rd SE
- 27 Hughes Dairy Rd SE
- 11 Ridgeview Dr SE
- 81 John Ingram Rd SE
- 81 John Ingram Rd SE
- 27 John Ingram Rd SE
- 82 John Ingram Rd SE
- 20 John Ingram Rd SE
- 96 John Ingram Rd SE
- 0 John Ingram Rd SE
- 0 John Ingram Rd SE Unit 6996981
- 0 John Ingram Rd SE Unit 20016069
- 0 John Ingram Rd SE Unit 7595277
- 0 John Ingram Rd SE Unit 7328801
- 0 John Ingram Rd SE Unit 7473613
- 0 John Ingram Rd SE Unit 7401758
- 0 John Ingram Rd SE Unit 7092407
- 0 John Ingram Rd SE Unit 7033625
- 0 John Ingram Rd SE Unit 3232110
- 0 John Ingram Rd SE Unit 7382910
- 0 John Ingram Rd SE Unit 20002130
- 0 John Ingram Rd SE Unit 9020219
- 0 John Ingram Rd SE Unit 6879872