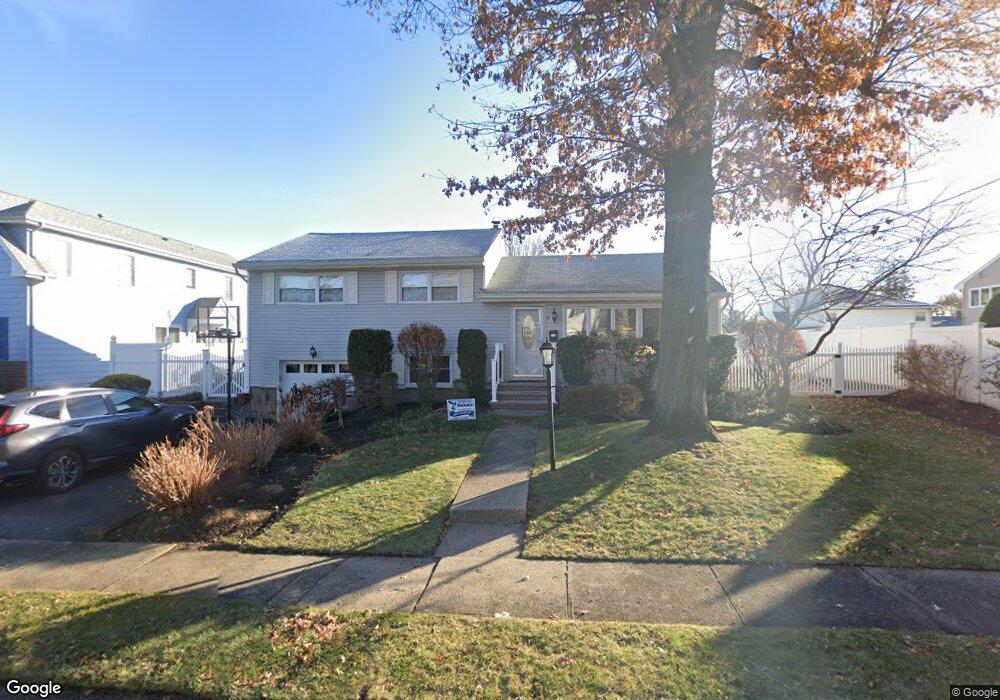
51 Juniper St Dumont, NJ 07628
Estimated Value: $629,073 - $681,000
Studio
--
Bath
1,508
Sq Ft
$435/Sq Ft
Est. Value
About This Home
This home is located at 51 Juniper St, Dumont, NJ 07628 and is currently estimated at $655,768, approximately $434 per square foot. 51 Juniper St is a home located in Bergen County with nearby schools including Dumont High School.
Ownership History
Date
Name
Owned For
Owner Type
Purchase Details
Closed on
Mar 1, 2007
Current Estimated Value
Home Financials for this Owner
Home Financials are based on the most recent Mortgage that was taken out on this home.
Original Mortgage
$362,800
Outstanding Balance
$214,208
Interest Rate
6.27%
Estimated Equity
$441,560
Purchase Details
Closed on
Feb 14, 2007
Home Financials for this Owner
Home Financials are based on the most recent Mortgage that was taken out on this home.
Original Mortgage
$362,800
Outstanding Balance
$214,208
Interest Rate
6.27%
Estimated Equity
$441,560
Purchase Details
Closed on
Jul 27, 2006
Sold by
Waller Eric K
Create a Home Valuation Report for This Property
The Home Valuation Report is an in-depth analysis detailing your home's value as well as a comparison with similar homes in the area
Home Values in the Area
Average Home Value in this Area
Purchase History
| Date | Buyer | Sale Price | Title Company |
|---|---|---|---|
| -- | -- | -- | |
| -- | $453,500 | -- | |
| -- | $418,000 | -- |
Source: Public Records
Mortgage History
| Date | Status | Borrower | Loan Amount |
|---|---|---|---|
| Open | -- | $362,800 |
Source: Public Records
Tax History
| Year | Tax Paid | Tax Assessment Tax Assessment Total Assessment is a certain percentage of the fair market value that is determined by local assessors to be the total taxable value of land and additions on the property. | Land | Improvement |
|---|---|---|---|---|
| 2025 | $12,443 | $533,700 | $335,800 | $197,900 |
| 2024 | $12,137 | $306,100 | $181,300 | $124,800 |
| 2023 | $11,886 | $306,100 | $181,300 | $124,800 |
| 2022 | $11,886 | $306,100 | $181,300 | $124,800 |
| 2021 | $11,828 | $306,100 | $181,300 | $124,800 |
| 2020 | $11,506 | $306,100 | $181,300 | $124,800 |
| 2019 | $11,231 | $306,100 | $181,300 | $124,800 |
| 2018 | $11,001 | $306,100 | $181,300 | $124,800 |
| 2017 | $10,790 | $306,100 | $181,300 | $124,800 |
| 2016 | $10,539 | $306,100 | $181,300 | $124,800 |
| 2015 | $10,297 | $306,100 | $181,300 | $124,800 |
| 2014 | $10,095 | $306,100 | $181,300 | $124,800 |
Source: Public Records
Map
Nearby Homes
- 15 Pleasant St
- 116 Lexington Ave
- 67 Central Ave
- 42 Lenox Ave
- 112 Oxford Place
- 57 Merrifield Way
- 64 Harwich Rd
- 71 Stewart St
- 31 Madison Ave
- 7 Overlook Dr
- 38 Madison Ave
- 226 Haworth Ave
- 106 Prescott St
- 284 Madison Ave
- 126 Grant Ave
- 206 10th St
- 225 12th St
- 232 County Rd
- 292 Magnolia Ave
- 82 Blauvelt Ave
- 186 Delong Ave Unit AE
- 59 Juniper St
- 46 Harrison St
- 54 Harrison St
- 52 Juniper St
- 198 Delong Ave
- 62 Harrison St
- 67 Juniper St
- 60 Juniper St
- 176 Delong Ave
- 187 Delong Ave
- 70 Harrison St
- 68 Juniper St
- 199 Delong Ave
- 53 Garfield St
- 206 Delong Ave
- 53 Harrison St
- 73 Juniper St
- 61 Garfield St
- 179 Delong Ave
Your Personal Tour Guide
Ask me questions while you tour the home.