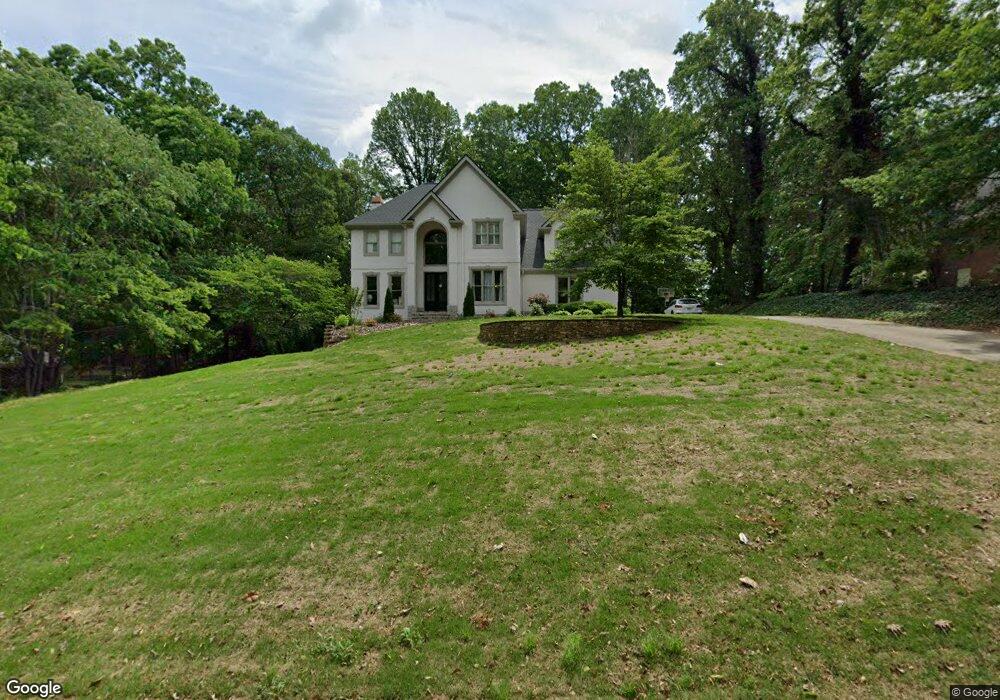
51 Laurel Lakes Dr Carrollton, GA 30116
Estimated Value: $466,825 - $586,000
4
Beds
4
Baths
2,770
Sq Ft
$185/Sq Ft
Est. Value
About This Home
This home is located at 51 Laurel Lakes Dr, Carrollton, GA 30116 and is currently estimated at $511,956, approximately $184 per square foot. 51 Laurel Lakes Dr is a home located in Carroll County with nearby schools including Central Elementary School, Central Middle School, and Central High School.
Ownership History
Date
Name
Owned For
Owner Type
Purchase Details
Closed on
Aug 10, 2023
Sold by
Etheridge Marie
Bought by
Jenkins Casey Smith and Jenkins Jeffrey N
Current Estimated Value
Home Financials for this Owner
Home Financials are based on the most recent Mortgage that was taken out on this home.
Original Mortgage
$286,200
Outstanding Balance
$279,310
Interest Rate
6.96%
Mortgage Type
New Conventional
Estimated Equity
$232,646
Purchase Details
Closed on
Oct 23, 2020
Sold by
Denmon David R
Bought by
Etheridge Marie
Purchase Details
Closed on
May 7, 2002
Sold by
Drew Robert David
Bought by
Denmon David R and Denmon Lisanne C
Purchase Details
Closed on
Sep 28, 1995
Bought by
Drew Robert David
Purchase Details
Closed on
Dec 2, 1992
Bought by
Winiger
Purchase Details
Closed on
Jan 31, 1992
Bought by
Buchanan
Create a Home Valuation Report for This Property
The Home Valuation Report is an in-depth analysis detailing your home's value as well as a comparison with similar homes in the area
Home Values in the Area
Average Home Value in this Area
Purchase History
| Date | Buyer | Sale Price | Title Company |
|---|---|---|---|
| Jenkins Casey Smith | $477,000 | -- | |
| Etheridge Marie | $295,000 | -- | |
| Denmon David R | $267,900 | -- | |
| Drew Robert David | $189,900 | -- | |
| Winiger | $184,000 | -- | |
| Buchanan | $16,000 | -- |
Source: Public Records
Mortgage History
| Date | Status | Borrower | Loan Amount |
|---|---|---|---|
| Open | Jenkins Casey Smith | $286,200 |
Source: Public Records
Tax History Compared to Growth
Tax History
| Year | Tax Paid | Tax Assessment Tax Assessment Total Assessment is a certain percentage of the fair market value that is determined by local assessors to be the total taxable value of land and additions on the property. | Land | Improvement |
|---|---|---|---|---|
| 2025 | $4,272 | $190,962 | $11,550 | $179,412 |
| 2024 | $4,316 | $190,962 | $11,550 | $179,412 |
| 2023 | $4,316 | $174,485 | $11,550 | $162,935 |
| 2022 | $3,572 | $142,430 | $11,550 | $130,880 |
| 2021 | $3,025 | $123,458 | $11,550 | $111,908 |
| 2020 | $2,616 | $112,680 | $11,550 | $101,130 |
| 2019 | $2,496 | $105,046 | $11,550 | $93,496 |
| 2018 | $2,352 | $95,186 | $11,550 | $83,636 |
| 2017 | $2,351 | $94,786 | $11,550 | $83,236 |
| 2016 | $2,352 | $94,786 | $11,550 | $83,236 |
| 2015 | $2,676 | $103,862 | $11,550 | $92,313 |
| 2014 | $2,687 | $103,863 | $11,550 | $92,313 |
Source: Public Records
Map
Nearby Homes
- 52 Castleman Rd
- 0 Cross Plains Rd Unit 10644288
- 0 Cross Plains Rd Unit 7682594
- 0 Bankhead Hwy and Sassafras Unit 202
- 391 Foggy Bottom Dr
- 252 Mink Hollow Dr
- 103 Birkdale Blvd
- 1005 Oak Mountain Rd
- 158 Foggy Bottom Dr
- 109 National Way
- 2181 2201 Star Point
- 214 Asher Dr
- 116 Camilla Dr
- 1265 Horsley Mill Rd
- 835 Eagles Nest Cir
- 971 Horsley Mill Rd
- 103 Champion Dr
- 409 Reids Mill Way
- 1209 Old Newnan Rd
- 1201 Old Newnan Rd
- 63 Laurel Lakes Dr
- 39 Laurel Lakes Dr
- 0 Castleman Rd Unit 10501700
- 0 Castleman Rd Unit 20166062
- 0 Castleman Rd Unit 10025324
- 0 Castleman Rd Unit 8979594
- 0 Castleman Rd Unit 8820772
- 66 Castleman Rd
- 40 Castleman Rd
- 75 Laurel Lakes Dr
- 29 Laurel Lakes Dr
- 60 Laurel Lakes Dr
- 42 Laurel Lakes Dr
- 80 Castleman Rd
- 34 Laurel Lakes Dr
- 72 Laurel Lakes Dr
- 96 Castleman Rd
- 87 Laurel Lakes Dr
- 53 Castleman Rd
- 33 Castleman Rd