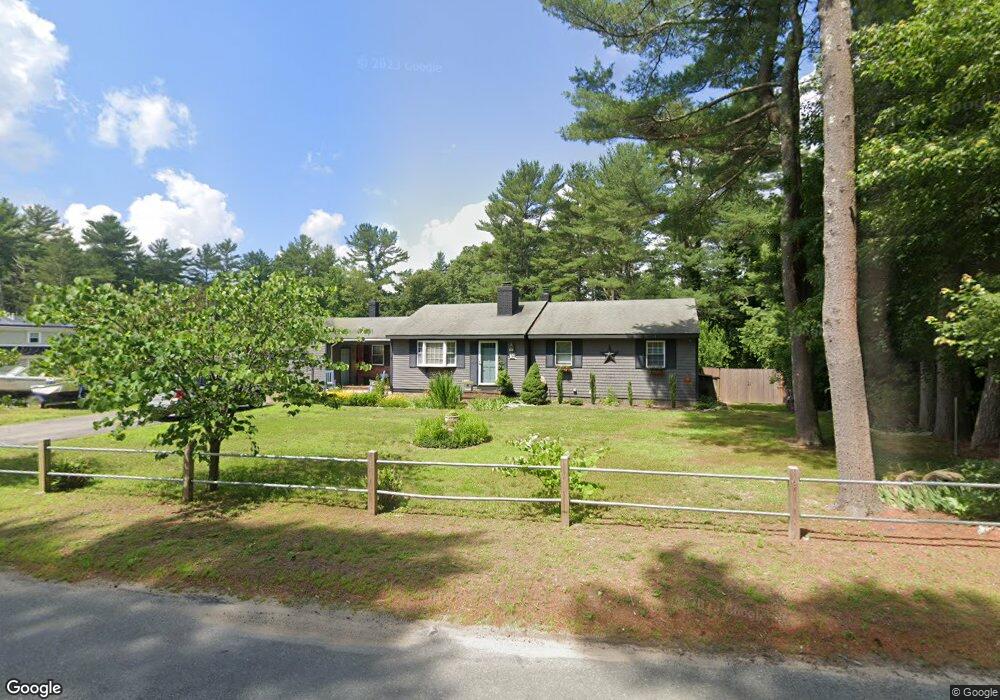
51 Locust St Assonet, MA 02702
Assonet NeighborhoodEstimated Value: $539,000 - $568,000
3
Beds
3
Baths
1,390
Sq Ft
$397/Sq Ft
Est. Value
About This Home
This home is located at 51 Locust St, Assonet, MA 02702 and is currently estimated at $551,352, approximately $396 per square foot. 51 Locust St is a home located in Bristol County with nearby schools including Freetown Elementary School, George R Austin Intermediate School, and Freetown-Lakeville Middle School.
Ownership History
Date
Name
Owned For
Owner Type
Purchase Details
Closed on
Oct 27, 2006
Sold by
Antunes Barbara E and Antunes Raymond Joseph
Bought by
Cook James F and Cook Lori Ann
Current Estimated Value
Home Financials for this Owner
Home Financials are based on the most recent Mortgage that was taken out on this home.
Original Mortgage
$284,000
Outstanding Balance
$168,780
Interest Rate
6.48%
Mortgage Type
Purchase Money Mortgage
Estimated Equity
$382,572
Create a Home Valuation Report for This Property
The Home Valuation Report is an in-depth analysis detailing your home's value as well as a comparison with similar homes in the area
Home Values in the Area
Average Home Value in this Area
Purchase History
| Date | Buyer | Sale Price | Title Company |
|---|---|---|---|
| Cook James F | $355,000 | -- |
Source: Public Records
Mortgage History
| Date | Status | Borrower | Loan Amount |
|---|---|---|---|
| Open | Cook James F | $284,000 |
Source: Public Records
Tax History Compared to Growth
Tax History
| Year | Tax Paid | Tax Assessment Tax Assessment Total Assessment is a certain percentage of the fair market value that is determined by local assessors to be the total taxable value of land and additions on the property. | Land | Improvement |
|---|---|---|---|---|
| 2025 | $4,734 | $477,700 | $160,700 | $317,000 |
| 2024 | $4,705 | $451,100 | $151,600 | $299,500 |
| 2023 | $4,576 | $427,300 | $136,500 | $290,800 |
| 2022 | $4,413 | $365,900 | $115,600 | $250,300 |
| 2021 | $4,248 | $334,500 | $105,100 | $229,400 |
| 2020 | $4,179 | $321,000 | $101,100 | $219,900 |
| 2019 | $3,991 | $303,500 | $96,300 | $207,200 |
| 2018 | $3,772 | $283,400 | $96,300 | $187,100 |
| 2017 | $3,668 | $275,400 | $96,300 | $179,100 |
| 2016 | $3,470 | $265,100 | $93,500 | $171,600 |
| 2015 | $3,206 | $248,500 | $93,500 | $155,000 |
| 2014 | $3,002 | $238,100 | $91,600 | $146,500 |
Source: Public Records
Map
Nearby Homes
- 6 Weetamoe Dr
- 1 Elm St
- 5 Hadley Heights Way
- 16 Water St Unit A
- 16 Water St Unit C
- 16 Water St Unit B
- 16 Water St Unit D
- 4 Hadley Heights Way
- 20 Slab Bridge Rd
- 37 Simpson Ln
- 22 Freemens Cir
- 52 Anthony St
- 17 E Public St
- 42 High St
- 7 Eric Dr
- 66 S Main St
- 59 Seymour St
- 0 Bayview Ave
- 125 Bayview Ave
- 7 Great Cedar Crossing