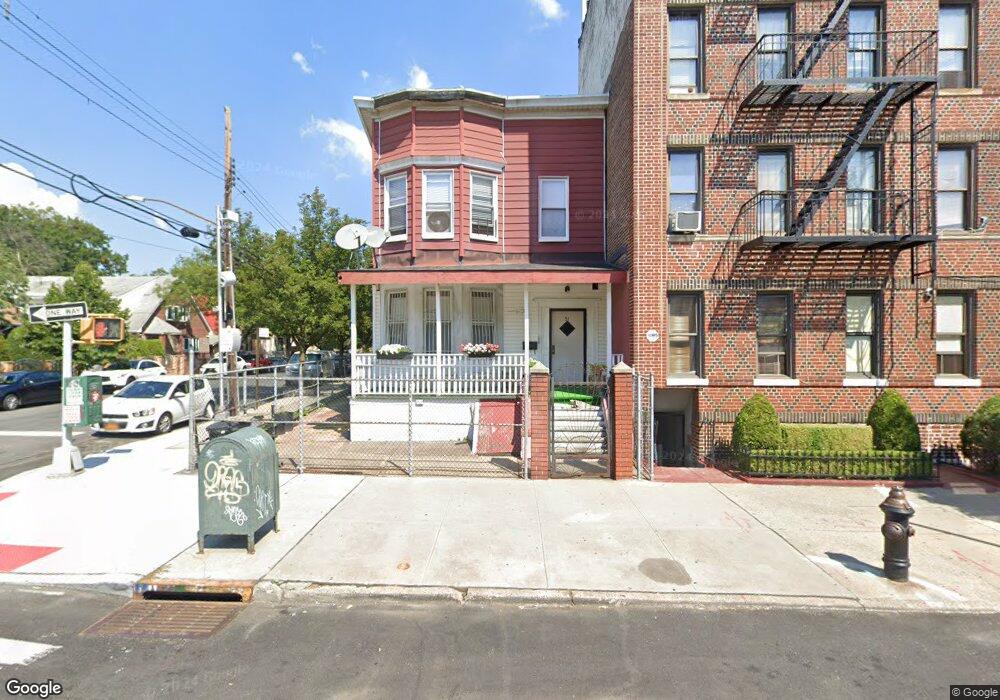
51 Logan St Brooklyn, NY 11208
Cypress Hills NeighborhoodEstimated Value: $995,000 - $1,232,000
--
Bed
--
Bath
3,322
Sq Ft
$336/Sq Ft
Est. Value
About This Home
This home is located at 51 Logan St, Brooklyn, NY 11208 and is currently estimated at $1,116,000, approximately $335 per square foot. 51 Logan St is a home located in Kings County with nearby schools including Earl Boyles Elementary School, P.S. 65, and Westridge Elementary School.
Ownership History
Date
Name
Owned For
Owner Type
Purchase Details
Closed on
Nov 22, 2004
Sold by
Subick Lilowatic and Subick Rishee
Bought by
Subick Rishee
Current Estimated Value
Home Financials for this Owner
Home Financials are based on the most recent Mortgage that was taken out on this home.
Original Mortgage
$350,000
Interest Rate
5.78%
Mortgage Type
Purchase Money Mortgage
Purchase Details
Closed on
Jan 27, 1996
Sold by
Govindan Sammy
Bought by
Govindan Sammy and Govindan Sita
Create a Home Valuation Report for This Property
The Home Valuation Report is an in-depth analysis detailing your home's value as well as a comparison with similar homes in the area
Home Values in the Area
Average Home Value in this Area
Purchase History
| Date | Buyer | Sale Price | Title Company |
|---|---|---|---|
| Subick Rishee | -- | -- | |
| Subick Rishee | -- | -- | |
| Govindan Sammy | $10,000 | Lawyers Title Insurance Corp | |
| Govindan Sammy | -- | Lawyers Title Insurance Corp |
Source: Public Records
Mortgage History
| Date | Status | Borrower | Loan Amount |
|---|---|---|---|
| Closed | Subick Rishee | $350,000 |
Source: Public Records
Tax History Compared to Growth
Tax History
| Year | Tax Paid | Tax Assessment Tax Assessment Total Assessment is a certain percentage of the fair market value that is determined by local assessors to be the total taxable value of land and additions on the property. | Land | Improvement |
|---|---|---|---|---|
| 2025 | $7,225 | $73,620 | $25,140 | $48,480 |
| 2024 | $7,225 | $71,100 | $25,140 | $45,960 |
| 2023 | $6,898 | $72,420 | $25,140 | $47,280 |
| 2022 | $6,401 | $73,560 | $25,140 | $48,420 |
| 2021 | $4,788 | $70,020 | $25,140 | $44,880 |
| 2020 | $3,167 | $55,800 | $25,140 | $30,660 |
| 2019 | $6,271 | $55,800 | $25,140 | $30,660 |
| 2018 | $5,770 | $28,305 | $14,481 | $13,824 |
| 2017 | $5,447 | $26,722 | $14,119 | $12,603 |
| 2016 | $5,044 | $25,230 | $17,560 | $7,670 |
| 2015 | $3,041 | $25,230 | $16,880 | $8,350 |
| 2014 | $3,041 | $24,980 | $14,200 | $10,780 |
Source: Public Records
Map
Nearby Homes