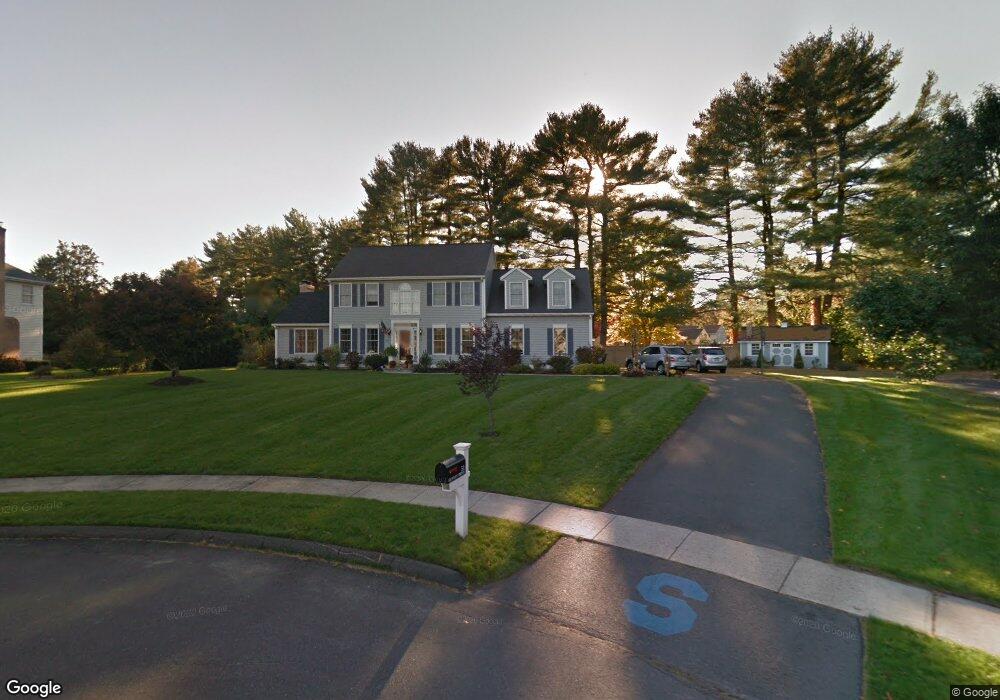
51 Lovley Dr Plantsville, CT 06479
Estimated Value: $653,372 - $791,000
4
Beds
3
Baths
2,317
Sq Ft
$304/Sq Ft
Est. Value
About This Home
This home is located at 51 Lovley Dr, Plantsville, CT 06479 and is currently estimated at $703,593, approximately $303 per square foot. 51 Lovley Dr is a home located in Hartford County with nearby schools including Strong School, John F. Kennedy Middle School, and Southington High School.
Ownership History
Date
Name
Owned For
Owner Type
Purchase Details
Closed on
Jul 7, 2017
Sold by
Agli Michael J
Bought by
Agli Christine L
Current Estimated Value
Purchase Details
Closed on
Nov 29, 2016
Sold by
Carr Ernest R and Carr Kimberly A
Bought by
Agli Michael J
Home Financials for this Owner
Home Financials are based on the most recent Mortgage that was taken out on this home.
Original Mortgage
$275,000
Interest Rate
3.47%
Mortgage Type
Purchase Money Mortgage
Purchase Details
Closed on
Feb 16, 2001
Sold by
Mihulka Adam K and Mihulka Beata
Bought by
Carr Ernest R and Carr Kimberly A
Purchase Details
Closed on
May 5, 1999
Sold by
Lovley Development Inc
Bought by
Mihulka Adams K and Mihulka Beata
Create a Home Valuation Report for This Property
The Home Valuation Report is an in-depth analysis detailing your home's value as well as a comparison with similar homes in the area
Home Values in the Area
Average Home Value in this Area
Purchase History
| Date | Buyer | Sale Price | Title Company |
|---|---|---|---|
| Agli Christine L | -- | -- | |
| Agli Michael J | $445,000 | -- | |
| Carr Ernest R | $282,500 | -- | |
| Mihulka Adams K | $242,938 | -- |
Source: Public Records
Mortgage History
| Date | Status | Borrower | Loan Amount |
|---|---|---|---|
| Previous Owner | Agli Michael J | $275,000 | |
| Previous Owner | Mihulka Adams K | $288,000 | |
| Previous Owner | Mihulka Adams K | $254,550 | |
| Previous Owner | Mihulka Adams K | $80,000 |
Source: Public Records
Tax History
| Year | Tax Paid | Tax Assessment Tax Assessment Total Assessment is a certain percentage of the fair market value that is determined by local assessors to be the total taxable value of land and additions on the property. | Land | Improvement |
|---|---|---|---|---|
| 2025 | $9,261 | $278,860 | $86,340 | $192,520 |
| 2024 | $8,767 | $278,860 | $86,340 | $192,520 |
| 2023 | $8,466 | $278,860 | $86,340 | $192,520 |
| 2022 | $8,123 | $278,860 | $86,340 | $192,520 |
| 2021 | $8,095 | $278,860 | $86,340 | $192,520 |
| 2020 | $8,603 | $280,870 | $88,100 | $192,770 |
| 2019 | $8,606 | $280,870 | $88,100 | $192,770 |
| 2018 | $8,561 | $280,870 | $88,100 | $192,770 |
| 2017 | $8,561 | $280,870 | $88,100 | $192,770 |
| 2016 | $7,823 | $263,940 | $88,100 | $175,840 |
| 2015 | $7,422 | $254,710 | $83,900 | $170,810 |
| 2014 | $7,224 | $254,710 | $83,900 | $170,810 |
Source: Public Records
Map
Nearby Homes
- 60 Frost St
- 60 Union St
- 560 Marion Ave
- 566 Marion Ave Unit Lot 10
- 566 Marion Ave
- 349 Marion Ave Unit 18
- 349 Marion Ave Unit 12
- 349 Marion Ave Unit 27
- 349 Marion Ave Unit 25
- 349 Marion Ave Unit 22
- 349 Marion Ave Unit 26
- 349 Marion Ave Unit 21
- 349 Marion Ave Unit 23
- 349 Marion Ave Unit 24
- 791 Prospect St
- 151 Diana Rd
- 60 Roseanna Rd
- 88 October Ln
- 943 Mount Vernon Rd
- 962 S Main St Unit 17
Your Personal Tour Guide
Ask me questions while you tour the home.