Estimated Value: $216,999 - $244,000
2
Beds
1
Bath
1,029
Sq Ft
$221/Sq Ft
Est. Value
About This Home
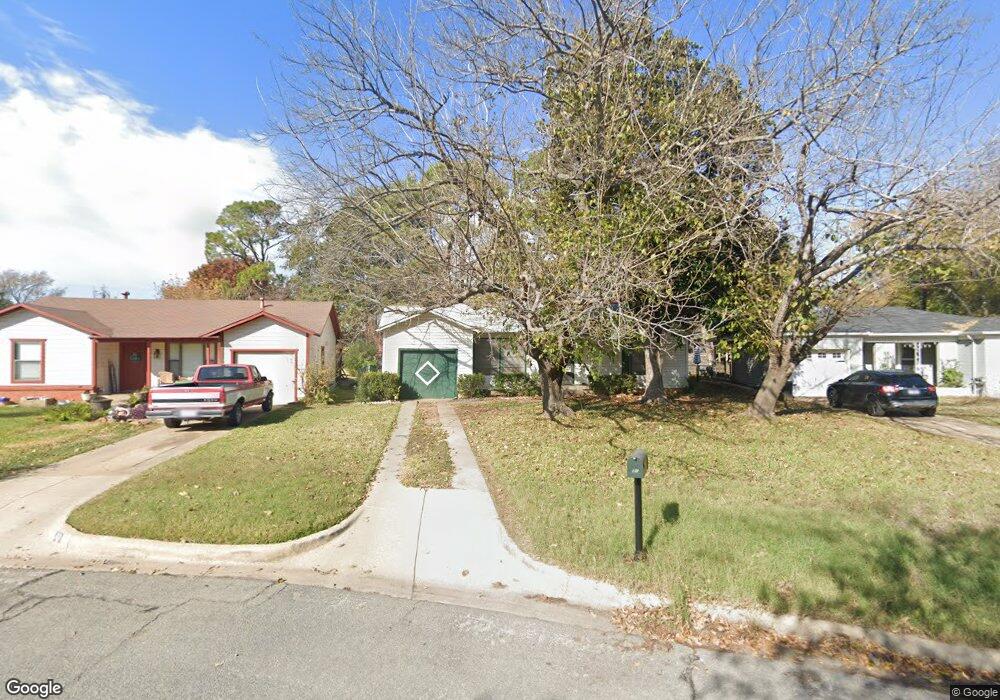
This home is located at 51 Lynn Ct, Hurst, TX 76053 and is currently estimated at $227,750, approximately $221 per square foot. 51 Lynn Ct is a home located in Tarrant County with nearby schools including Harrison Lane Elementary School, Hurst J High School, and L.D. Bell High School.
Ownership History
Date
Name
Owned For
Owner Type
Purchase Details
Closed on
Sep 24, 2004
Sold by
Johnson Shaun R
Bought by
Matthews Richard Paul
Current Estimated Value
Home Financials for this Owner
Home Financials are based on the most recent Mortgage that was taken out on this home.
Original Mortgage
$78,358
Outstanding Balance
$35,726
Interest Rate
5.81%
Mortgage Type
FHA
Estimated Equity
$192,024
Purchase Details
Closed on
Apr 9, 1999
Sold by
Perritt Trudy A
Bought by
Johnson Shaun R
Home Financials for this Owner
Home Financials are based on the most recent Mortgage that was taken out on this home.
Original Mortgage
$58,517
Interest Rate
6.89%
Mortgage Type
FHA
Purchase Details
Closed on
Jan 25, 1996
Sold by
Hume Retha G
Bought by
Perritt Trudy A
Purchase Details
Closed on
Jan 17, 1996
Sold by
Perritt Trudy A and Coffin Calvin E
Bought by
Perritt Trudy A and Hume Retha G
Purchase Details
Closed on
Sep 23, 1994
Sold by
Coffin Calvin E and Coffin Thelma I
Bought by
Coffin Calvin E
Create a Home Valuation Report for This Property
The Home Valuation Report is an in-depth analysis detailing your home's value as well as a comparison with similar homes in the area
Home Values in the Area
Average Home Value in this Area
Purchase History
| Date | Buyer | Sale Price | Title Company |
|---|---|---|---|
| Matthews Richard Paul | -- | -- | |
| Johnson Shaun R | -- | Commonwealth Land Title | |
| Perritt Trudy A | -- | -- | |
| Perritt Trudy A | -- | -- | |
| Coffin Calvin E | -- | -- |
Source: Public Records
Mortgage History
| Date | Status | Borrower | Loan Amount |
|---|---|---|---|
| Open | Matthews Richard Paul | $78,358 | |
| Previous Owner | Johnson Shaun R | $58,517 |
Source: Public Records
Tax History
| Year | Tax Paid | Tax Assessment Tax Assessment Total Assessment is a certain percentage of the fair market value that is determined by local assessors to be the total taxable value of land and additions on the property. | Land | Improvement |
|---|---|---|---|---|
| 2025 | $2,000 | $187,000 | $55,000 | $132,000 |
| 2024 | $2,000 | $203,236 | $55,000 | $148,236 |
| 2023 | $2,976 | $201,000 | $35,000 | $166,000 |
| 2022 | $3,109 | $182,478 | $35,000 | $147,478 |
| 2021 | $2,961 | $165,118 | $35,000 | $130,118 |
| 2020 | $2,685 | $143,622 | $35,000 | $108,622 |
| 2019 | $2,483 | $134,399 | $35,000 | $99,399 |
| 2018 | $1,769 | $92,238 | $15,000 | $77,238 |
| 2017 | $2,122 | $103,013 | $15,000 | $88,013 |
| 2016 | $1,929 | $92,716 | $15,000 | $77,716 |
| 2015 | $1,458 | $69,300 | $13,500 | $55,800 |
| 2014 | $1,458 | $69,300 | $13,500 | $55,800 |
Source: Public Records
Map
Nearby Homes
Your Personal Tour Guide
Ask me questions while you tour the home.