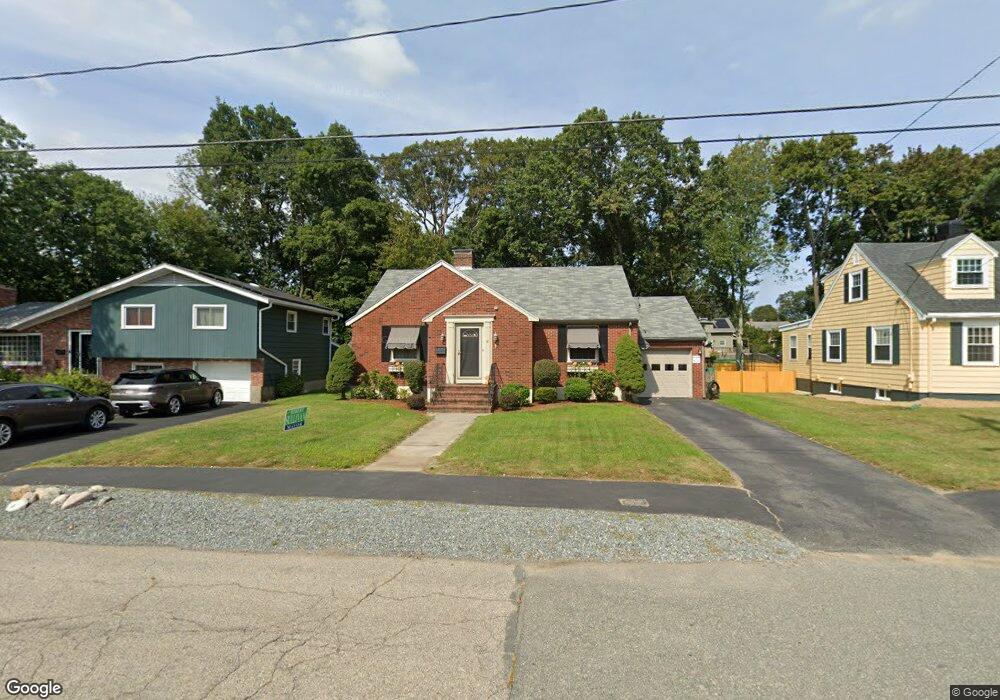
51 Marlene Ave Brockton, MA 02301
Estimated Value: $420,000 - $489,000
2
Beds
2
Baths
1,140
Sq Ft
$404/Sq Ft
Est. Value
About This Home
This home is located at 51 Marlene Ave, Brockton, MA 02301 and is currently estimated at $460,975, approximately $404 per square foot. 51 Marlene Ave is a home located in Plymouth County with nearby schools including Manthala George Jr. School, Hancock Elementary School, and Louis F Angelo Elementary School.
Ownership History
Date
Name
Owned For
Owner Type
Purchase Details
Closed on
May 29, 2025
Sold by
Duggan John G
Bought by
Duggan
Current Estimated Value
Purchase Details
Closed on
Aug 6, 1996
Sold by
Brass Norma
Bought by
Duggan John G
Home Financials for this Owner
Home Financials are based on the most recent Mortgage that was taken out on this home.
Original Mortgage
$97,850
Interest Rate
8.27%
Mortgage Type
Purchase Money Mortgage
Create a Home Valuation Report for This Property
The Home Valuation Report is an in-depth analysis detailing your home's value as well as a comparison with similar homes in the area
Home Values in the Area
Average Home Value in this Area
Purchase History
| Date | Buyer | Sale Price | Title Company |
|---|---|---|---|
| Duggan | -- | None Available | |
| Duggan | -- | None Available | |
| Duggan John G | $103,000 | -- | |
| Duggan John G | $103,000 | -- |
Source: Public Records
Mortgage History
| Date | Status | Borrower | Loan Amount |
|---|---|---|---|
| Previous Owner | Duggan John G | $25,000 | |
| Previous Owner | Duggan John G | $30,000 | |
| Previous Owner | Duggan John G | $97,850 |
Source: Public Records
Tax History Compared to Growth
Tax History
| Year | Tax Paid | Tax Assessment Tax Assessment Total Assessment is a certain percentage of the fair market value that is determined by local assessors to be the total taxable value of land and additions on the property. | Land | Improvement |
|---|---|---|---|---|
| 2025 | $5,265 | $434,800 | $144,500 | $290,300 |
| 2024 | $5,148 | $428,300 | $144,500 | $283,800 |
| 2023 | $5,147 | $396,500 | $109,300 | $287,200 |
| 2022 | $4,790 | $342,900 | $99,300 | $243,600 |
| 2021 | $4,478 | $308,800 | $92,900 | $215,900 |
| 2020 | $4,309 | $284,400 | $89,200 | $195,200 |
| 2019 | $4,129 | $265,700 | $83,100 | $182,600 |
| 2018 | $3,991 | $248,500 | $83,100 | $165,400 |
| 2017 | $3,603 | $223,800 | $83,100 | $140,700 |
| 2016 | $3,663 | $211,000 | $75,200 | $135,800 |
| 2015 | $3,247 | $178,900 | $75,200 | $103,700 |
| 2014 | $2,944 | $162,400 | $75,200 | $87,200 |
Source: Public Records
Map
Nearby Homes
- 28 Fern Ave
- 25 Monson St
- 37 West St
- 48 N Belcher Ave
- 17 Moraine Place
- 20 Montauk Rd
- 72 W Elm Terrace
- 67 Sycamore Ave Unit 3
- 161 Moraine St
- 21 Oneida Ave
- 77 Colonel Bell Dr Unit 4
- 45 Briarcliff Rd
- 61 Fairfield St
- 175 Belmont Ave
- 15 Byron Ave
- 78 Keene St
- 141 Prospect Ave
- 281 Spring St
- 190 Highland St
- 117 Fairview Ave