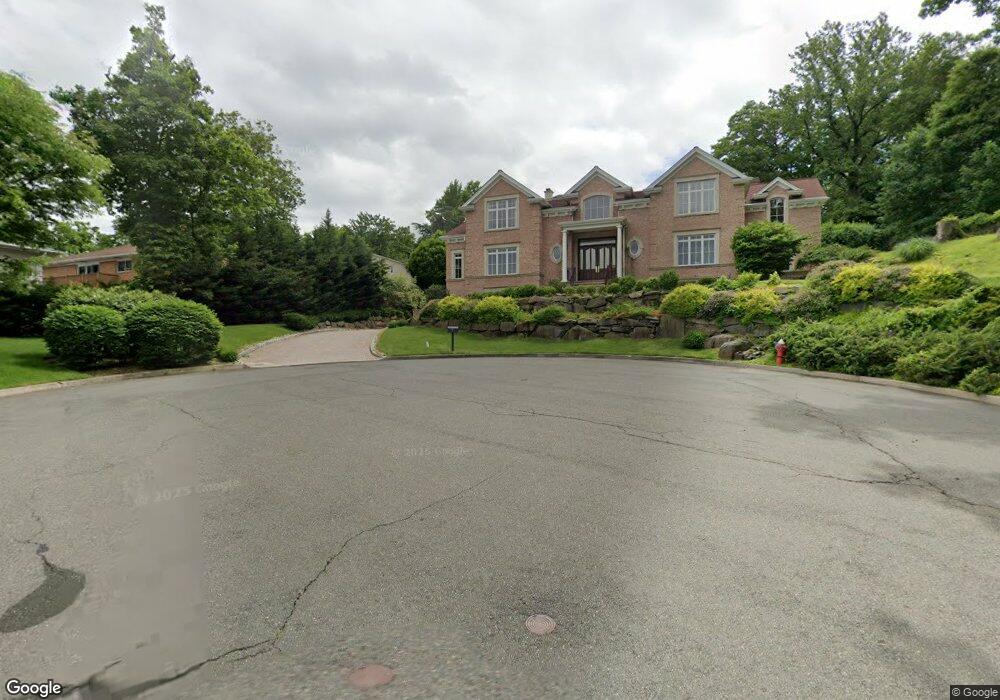
51 Mcdermott Way Englewood Cliffs, NJ 07632
Estimated Value: $2,187,000 - $2,696,000
5
Beds
5
Baths
5,404
Sq Ft
$463/Sq Ft
Est. Value
About This Home
This home is located at 51 Mcdermott Way, Englewood Cliffs, NJ 07632 and is currently estimated at $2,500,294, approximately $462 per square foot. 51 Mcdermott Way is a home located in Bergen County with nearby schools including North Cliff Elementary School, Upper School Elementary School, and Dwight-Englewood School.
Ownership History
Date
Name
Owned For
Owner Type
Purchase Details
Closed on
Mar 2, 2021
Sold by
Park Jessica Ae and Park Gene Jiyoon
Bought by
Tutelman Eduard and Zhislin Alla
Current Estimated Value
Purchase Details
Closed on
Jul 13, 2007
Sold by
The Frederic Co
Bought by
Park Yoon Sik
Home Financials for this Owner
Home Financials are based on the most recent Mortgage that was taken out on this home.
Original Mortgage
$1,500,000
Interest Rate
6.54%
Mortgage Type
New Conventional
Create a Home Valuation Report for This Property
The Home Valuation Report is an in-depth analysis detailing your home's value as well as a comparison with similar homes in the area
Home Values in the Area
Average Home Value in this Area
Purchase History
| Date | Buyer | Sale Price | Title Company |
|---|---|---|---|
| Tutelman Eduard | $1,850,000 | Blueland Title Agency Inc | |
| Park Yoon Sik | $2,500,000 | -- |
Source: Public Records
Mortgage History
| Date | Status | Borrower | Loan Amount |
|---|---|---|---|
| Previous Owner | Park Yoon Sik | $1,500,000 |
Source: Public Records
Tax History Compared to Growth
Tax History
| Year | Tax Paid | Tax Assessment Tax Assessment Total Assessment is a certain percentage of the fair market value that is determined by local assessors to be the total taxable value of land and additions on the property. | Land | Improvement |
|---|---|---|---|---|
| 2025 | $21,368 | $1,850,000 | $808,500 | $1,041,500 |
| 2024 | $21,109 | $1,850,000 | $808,500 | $1,041,500 |
| 2023 | $20,776 | $1,850,000 | $808,500 | $1,041,500 |
| 2022 | $20,776 | $1,850,000 | $808,500 | $1,041,500 |
| 2021 | $20,209 | $2,341,000 | $808,500 | $1,532,500 |
| 2020 | $26,945 | $2,341,000 | $808,500 | $1,532,500 |
| 2019 | $25,306 | $2,341,000 | $808,500 | $1,532,500 |
| 2018 | $24,417 | $2,341,000 | $808,500 | $1,532,500 |
| 2017 | $23,363 | $2,341,000 | $808,500 | $1,532,500 |
| 2016 | $22,918 | $2,341,000 | $808,500 | $1,532,500 |
| 2015 | $21,771 | $2,341,000 | $808,500 | $1,532,500 |
| 2014 | $20,367 | $2,341,000 | $808,500 | $1,532,500 |
Source: Public Records
Map
Nearby Homes
- 66 Elm St
- 12 Summit St
- 184 Jenkins Dr
- 51 Anderson Ave
- 505 Adele Ct
- 26 Sara Hill Ln
- 2460 1st St
- 312 Bolz St
- 316 Bolz St
- 470 Myrtle Ave
- 424 Myrtle Ave
- 422 Myrtle Ave
- 54 Van Nostrand Ave
- 2455 3rd St
- 485 Westview Place
- 300 Van Nostrand Ave
- 2446 3rd St
- 290 Van Nostrand Ave
- 2345 Linwood Ave Unit 4H
- 2345 Linwood Ave Unit LG