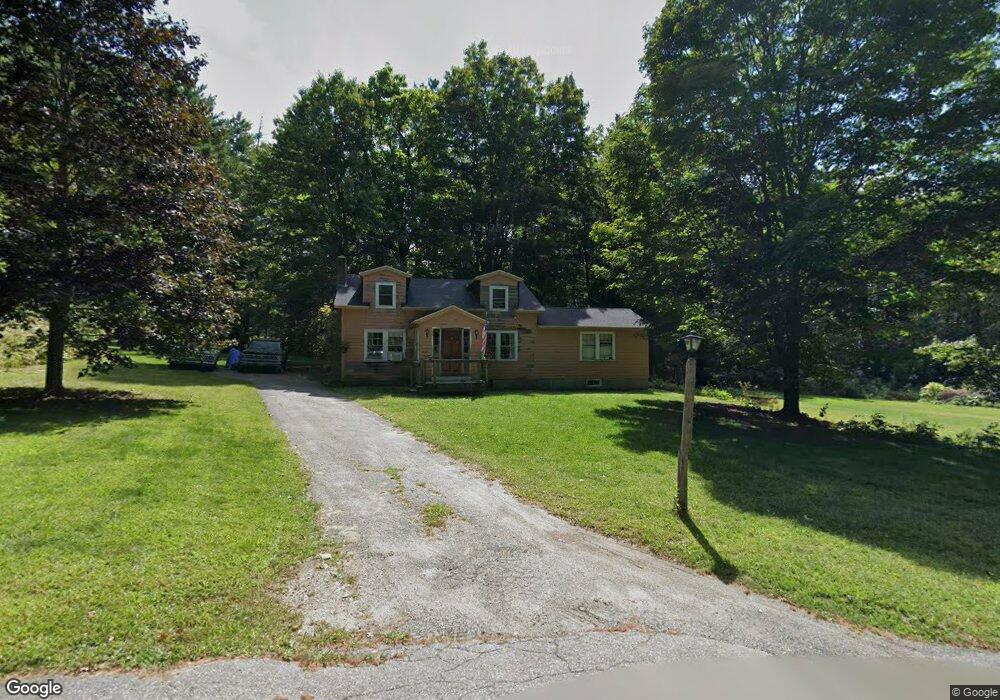
51 Meadow Rd Townsend, MA 01469
Estimated Value: $411,437 - $689,000
3
Beds
2
Baths
1,550
Sq Ft
$327/Sq Ft
Est. Value
About This Home
This home is located at 51 Meadow Rd, Townsend, MA 01469 and is currently estimated at $506,109, approximately $326 per square foot. 51 Meadow Rd is a home located in Middlesex County with nearby schools including North Middlesex Regional High School.
Ownership History
Date
Name
Owned For
Owner Type
Purchase Details
Closed on
Nov 20, 2020
Sold by
Beavers Kimberly M
Bought by
Simms Dana H
Current Estimated Value
Purchase Details
Closed on
Nov 5, 2012
Sold by
Simms Robert M and Simms Pamela J
Bought by
Simms Robert M
Purchase Details
Closed on
Oct 24, 1994
Sold by
Sullivan Mary H
Bought by
Simms Robert M and Simms Pamela J
Create a Home Valuation Report for This Property
The Home Valuation Report is an in-depth analysis detailing your home's value as well as a comparison with similar homes in the area
Home Values in the Area
Average Home Value in this Area
Purchase History
| Date | Buyer | Sale Price | Title Company |
|---|---|---|---|
| Simms Dana H | -- | None Available | |
| Simms Dana H | -- | None Available | |
| Simms Robert M | -- | -- | |
| Simms Robert M | $82,500 | -- |
Source: Public Records
Tax History
| Year | Tax Paid | Tax Assessment Tax Assessment Total Assessment is a certain percentage of the fair market value that is determined by local assessors to be the total taxable value of land and additions on the property. | Land | Improvement |
|---|---|---|---|---|
| 2025 | $4,809 | $331,200 | $93,400 | $237,800 |
| 2024 | $4,518 | $313,500 | $93,400 | $220,100 |
| 2023 | $4,479 | $293,500 | $84,900 | $208,600 |
| 2022 | $4,388 | $249,200 | $73,900 | $175,300 |
| 2021 | $4,231 | $230,800 | $73,100 | $157,700 |
| 2020 | $4,048 | $207,400 | $65,000 | $142,400 |
| 2019 | $3,876 | $200,500 | $65,000 | $135,500 |
| 2018 | $3,791 | $187,100 | $65,000 | $122,100 |
| 2017 | $3,615 | $183,800 | $69,200 | $114,600 |
| 2016 | $3,742 | $189,000 | $69,200 | $119,800 |
| 2015 | $3,583 | $187,500 | $72,200 | $115,300 |
| 2014 | $3,325 | $169,900 | $65,000 | $104,900 |
Source: Public Records
Map
Nearby Homes
- 0 Brookline St
- 364 Townsend Hill Rd
- 5 Turnpike Rd Unit 213 TWO
- 1 Depot Street Extension Unit 5
- 1 Depot Street Extension Unit 2
- 1 Depot Street Extension Unit 4
- 16 Worcester Rd
- 359 Main St
- 198 N End Rd
- 9 Kaneohe Ct
- 18 Beech St
- 143 Heald St
- 6 High Oaks Path
- 2 Blueberry Hill Rd
- 1235 Townsend Rd
- 86 W Elm Lunenburg Rd Blood Rd
- 9 Winterberry Rd
- 7 Winterberry Rd
- 3 Winterberry Rd
- 9 Quigley Way
Your Personal Tour Guide
Ask me questions while you tour the home.