Estimated Value: $175,000 - $276,000
4
Beds
2
Baths
2,250
Sq Ft
$101/Sq Ft
Est. Value
About This Home
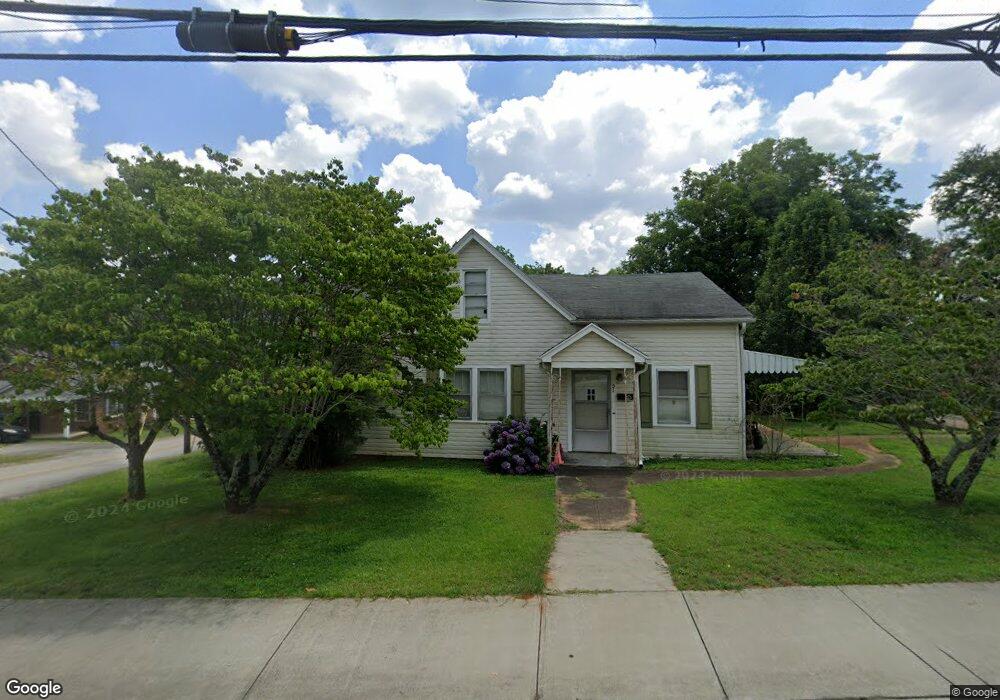
This home is located at 51 Mill St, Inman, SC 29349 and is currently estimated at $228,148, approximately $101 per square foot. 51 Mill St is a home located in Spartanburg County with nearby schools including Inman Elementary School, T.E. Mabry Middle School, and Chapman High School.
Ownership History
Date
Name
Owned For
Owner Type
Purchase Details
Closed on
Apr 6, 2017
Sold by
Gipa Llc
Bought by
Johnson Paul H and Johnson Anntte W
Current Estimated Value
Purchase Details
Closed on
Oct 18, 2012
Sold by
Sims Gene E
Bought by
Gipa Llc
Purchase Details
Closed on
Sep 14, 2011
Sold by
Hudson Stephanie N and Hudson Chester C
Bought by
Sims Gene E
Purchase Details
Closed on
Jan 14, 2009
Sold by
Sims Gene E
Bought by
Hudson Stephanie N and Hudson Chester C
Home Financials for this Owner
Home Financials are based on the most recent Mortgage that was taken out on this home.
Original Mortgage
$130,000
Interest Rate
5.24%
Mortgage Type
Purchase Money Mortgage
Purchase Details
Closed on
Mar 23, 2006
Sold by
Bradey William H and Brady Ludie W
Bought by
Brady Harold B
Purchase Details
Closed on
Nov 24, 2004
Sold by
Bradley William H
Bought by
Baker Pat
Purchase Details
Closed on
Nov 30, 2001
Sold by
Bradey William H and Walker Jane B
Bought by
Bradey William H and Brady Ludia W
Create a Home Valuation Report for This Property
The Home Valuation Report is an in-depth analysis detailing your home's value as well as a comparison with similar homes in the area
Home Values in the Area
Average Home Value in this Area
Purchase History
| Date | Buyer | Sale Price | Title Company |
|---|---|---|---|
| Johnson Paul H | $50,000 | None Available | |
| Gipa Llc | -- | -- | |
| Sims Gene E | -- | -- | |
| Hudson Stephanie N | $140,000 | -- | |
| Brady Harold B | -- | None Available | |
| Baker Pat | $2,200 | -- | |
| Bradey William H | -- | -- | |
| Sims Gene E | $40,700 | -- |
Source: Public Records
Mortgage History
| Date | Status | Borrower | Loan Amount |
|---|---|---|---|
| Previous Owner | Hudson Stephanie N | $130,000 |
Source: Public Records
Tax History Compared to Growth
Tax History
| Year | Tax Paid | Tax Assessment Tax Assessment Total Assessment is a certain percentage of the fair market value that is determined by local assessors to be the total taxable value of land and additions on the property. | Land | Improvement |
|---|---|---|---|---|
| 2025 | $3,127 | $6,693 | $1,006 | $5,687 |
| 2024 | $3,127 | $6,693 | $1,006 | $5,687 |
| 2023 | $3,127 | $6,693 | $1,006 | $5,687 |
| 2022 | $2,823 | $5,820 | $900 | $4,920 |
| 2021 | $2,794 | $5,820 | $900 | $4,920 |
| 2020 | $2,761 | $5,820 | $900 | $4,920 |
| 2019 | $2,778 | $5,820 | $900 | $4,920 |
| 2018 | $2,761 | $5,820 | $900 | $4,920 |
| 2017 | $2,029 | $4,338 | $600 | $3,738 |
| 2016 | $1,997 | $4,338 | $600 | $3,738 |
| 2015 | $1,992 | $4,338 | $600 | $3,738 |
| 2014 | $1,958 | $4,338 | $600 | $3,738 |
Source: Public Records
Map
Nearby Homes