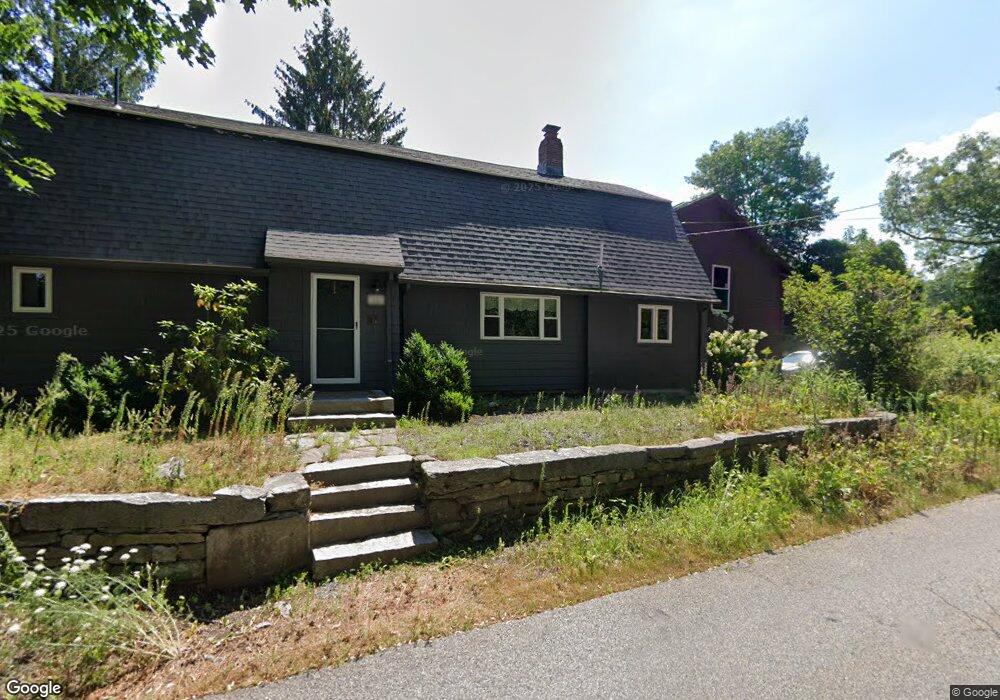
51 Morse St Westborough, MA 01581
Estimated Value: $707,000 - $1,101,000
4
Beds
5
Baths
2,711
Sq Ft
$331/Sq Ft
Est. Value
About This Home
This home is located at 51 Morse St, Westborough, MA 01581 and is currently estimated at $898,482, approximately $331 per square foot. 51 Morse St is a home located in Worcester County with nearby schools including Westborough High School, Ebridge Montessori School, and Westboro Knowledge Beginnings.
Ownership History
Date
Name
Owned For
Owner Type
Purchase Details
Closed on
Dec 7, 2016
Sold by
Cella Richard J
Bought by
Cella Richard J and Cella Christin C
Current Estimated Value
Purchase Details
Closed on
Feb 28, 2011
Sold by
Kronick Robin S
Bought by
Cella Richard J
Purchase Details
Closed on
Aug 12, 2004
Sold by
Macgregor John M and Macgregor Katrine B
Bought by
Cassidy Patrick F and Kronick Robin S
Home Financials for this Owner
Home Financials are based on the most recent Mortgage that was taken out on this home.
Original Mortgage
$333,700
Interest Rate
6.16%
Mortgage Type
Purchase Money Mortgage
Purchase Details
Closed on
May 27, 1998
Sold by
Lavallee Maureen M
Bought by
Macgregor John M and Mcgregor Kathrine B
Purchase Details
Closed on
Dec 31, 1991
Sold by
White Danny M
Bought by
Lavallee Maureen M and Christopher Vanklee
Create a Home Valuation Report for This Property
The Home Valuation Report is an in-depth analysis detailing your home's value as well as a comparison with similar homes in the area
Home Values in the Area
Average Home Value in this Area
Purchase History
| Date | Buyer | Sale Price | Title Company |
|---|---|---|---|
| Cella Richard J | -- | -- | |
| Cella Richard J | $330,000 | -- | |
| Cassidy Patrick F | $462,000 | -- | |
| Macgregor John M | $265,000 | -- | |
| Lavallee Maureen M | $224,500 | -- |
Source: Public Records
Mortgage History
| Date | Status | Borrower | Loan Amount |
|---|---|---|---|
| Previous Owner | Cassidy Patrick F | $333,700 | |
| Previous Owner | Lavallee Maureen M | $290,000 | |
| Previous Owner | Lavallee Maureen M | $209,500 |
Source: Public Records
Tax History Compared to Growth
Tax History
| Year | Tax Paid | Tax Assessment Tax Assessment Total Assessment is a certain percentage of the fair market value that is determined by local assessors to be the total taxable value of land and additions on the property. | Land | Improvement |
|---|---|---|---|---|
| 2025 | $9,640 | $591,800 | $291,800 | $300,000 |
| 2024 | $10,000 | $609,400 | $336,200 | $273,200 |
| 2023 | $9,383 | $557,200 | $319,600 | $237,600 |
| 2022 | $8,786 | $475,200 | $257,800 | $217,400 |
| 2021 | $8,324 | $449,000 | $231,600 | $217,400 |
| 2020 | $8,339 | $455,200 | $240,400 | $214,800 |
| 2019 | $8,362 | $456,200 | $240,400 | $215,800 |
| 2018 | $2,496 | $365,400 | $225,100 | $140,300 |
| 2017 | $6,504 | $365,400 | $225,100 | $140,300 |
| 2016 | $5,837 | $328,500 | $214,200 | $114,300 |
| 2015 | $6,058 | $325,900 | $214,200 | $111,700 |
Source: Public Records
Map
Nearby Homes
- 4 Upton Rd
- 39 Warren St
- 15 Beach St
- 2 Spring Ln
- 75 South St
- 56 Ruggles St
- 135 Fruit St
- 68 Spring St
- 27 Spring Rd
- 21 South St Unit 31
- 57 Spring Rd
- 7 Jennings Rd
- 14 Grove St Unit 2
- 46 Lackey St
- 23 Water St
- 6 Folly Ln
- 43 Church St
- 48 High Street Extension
- 7 Mayberry Dr Unit H
- 4403 Peters Farm Way Unit 403
- 46 Morse St
- 53 Morse St
- 67 Piccadilly Way
- 59 Hopkinton Rd
- 42 Morse St
- 42 Morse St Unit 1
- 65 Piccadilly Way
- 40 Morse St
- 69 Piccadilly Way
- 55 Piccadilly Way
- 57 Piccadilly Way
- 45 Morse St
- 53 Piccadilly Way
- 51 Hopkinton Rd
- 63 Piccadilly Way
- 38 Morse St
- 51 Lot 51 Piccadilly Way
- 51 Piccadilly Way
- 43 Morse St
- 69 Hopkinton Rd