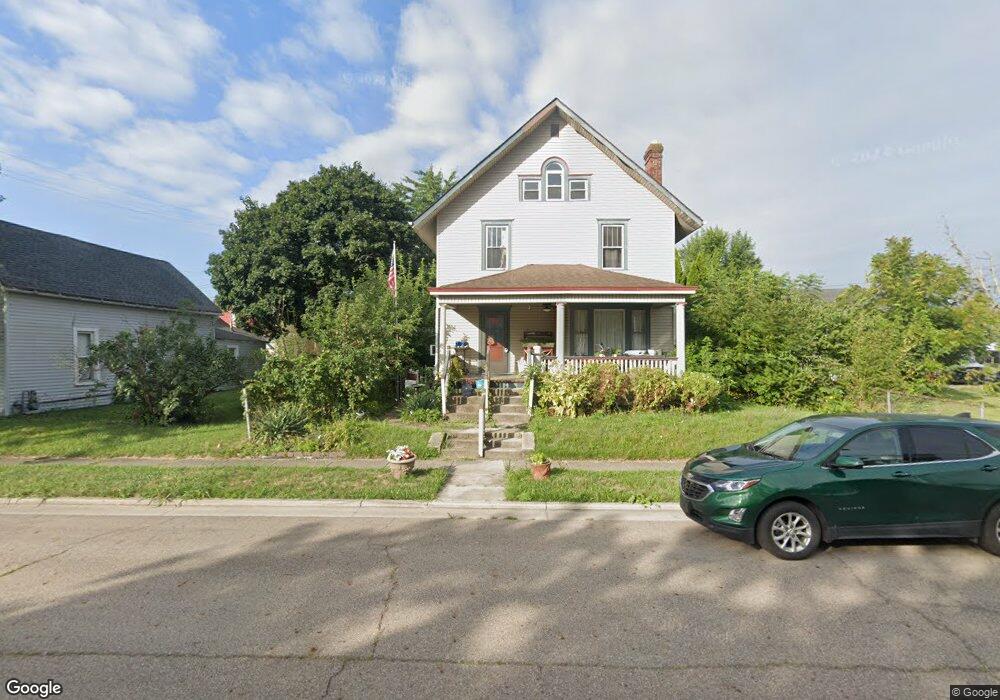
51 N High St Mount Sterling, OH 43143
Estimated Value: $230,691 - $265,000
4
Beds
2
Baths
2,096
Sq Ft
$121/Sq Ft
Est. Value
About This Home
This home is located at 51 N High St, Mount Sterling, OH 43143 and is currently estimated at $253,423, approximately $120 per square foot. 51 N High St is a home located in Madison County with nearby schools including Madison-Plains Elementary School, Madison-Plains Intermediate School, and Madison-Plains Junior High School.
Ownership History
Date
Name
Owned For
Owner Type
Purchase Details
Closed on
Mar 15, 2011
Sold by
Kemba Financial Credit Union
Bought by
Bryant Shelly E
Current Estimated Value
Home Financials for this Owner
Home Financials are based on the most recent Mortgage that was taken out on this home.
Original Mortgage
$98,341
Outstanding Balance
$68,014
Interest Rate
4.93%
Mortgage Type
New Conventional
Estimated Equity
$185,409
Purchase Details
Closed on
Feb 24, 2011
Sold by
Tipton Doris C
Bought by
Kemba Financial Credit Union Inc
Home Financials for this Owner
Home Financials are based on the most recent Mortgage that was taken out on this home.
Original Mortgage
$98,341
Outstanding Balance
$68,014
Interest Rate
4.93%
Mortgage Type
New Conventional
Estimated Equity
$185,409
Create a Home Valuation Report for This Property
The Home Valuation Report is an in-depth analysis detailing your home's value as well as a comparison with similar homes in the area
Home Values in the Area
Average Home Value in this Area
Purchase History
| Date | Buyer | Sale Price | Title Company |
|---|---|---|---|
| Bryant Shelly E | $94,900 | Williamson Title Agency | |
| Kemba Financial Credit Union Inc | -- | None Available |
Source: Public Records
Mortgage History
| Date | Status | Borrower | Loan Amount |
|---|---|---|---|
| Open | Bryant Shelly E | $98,341 |
Source: Public Records
Tax History Compared to Growth
Tax History
| Year | Tax Paid | Tax Assessment Tax Assessment Total Assessment is a certain percentage of the fair market value that is determined by local assessors to be the total taxable value of land and additions on the property. | Land | Improvement |
|---|---|---|---|---|
| 2024 | $1,810 | $51,650 | $8,480 | $43,170 |
| 2023 | $1,810 | $51,650 | $8,480 | $43,170 |
| 2022 | $1,484 | $40,030 | $6,580 | $33,450 |
| 2021 | $1,446 | $40,030 | $6,580 | $33,450 |
| 2020 | $1,449 | $40,030 | $6,580 | $33,450 |
| 2019 | $1,180 | $33,560 | $5,880 | $27,680 |
| 2018 | $1,180 | $33,560 | $5,880 | $27,680 |
| 2017 | $1,157 | $33,560 | $5,880 | $27,680 |
| 2016 | $966 | $29,140 | $5,880 | $23,260 |
| 2015 | $947 | $29,140 | $5,880 | $23,260 |
| 2014 | $947 | $29,140 | $5,880 | $23,260 |
| 2013 | -- | $35,040 | $5,240 | $29,800 |
Source: Public Records
Map
Nearby Homes
- 60 N London St
- 67 W Columbus St
- 94 Jefferson St
- 233 Rosewood Ave
- 223 W Main St
- 233 W Main St
- 230 W Columbus St
- 178 Poplar St
- 500 Wingate Place N
- 16185 State Route 207
- 14035 Woods Opossum Run Rd Unit R
- 15561 Blain Rd
- 8713 State Route 207
- 12265 Woods Opossum Run
- 11850 Woods Opossum
- 0 Renick Rd
- 16270 Cook Yankeetown Rd NE
- 10586 Baldwin Rd
- 0 Rockwell Rd Unit 225016734
- 13810 Yankeetown Chenoweth Rd