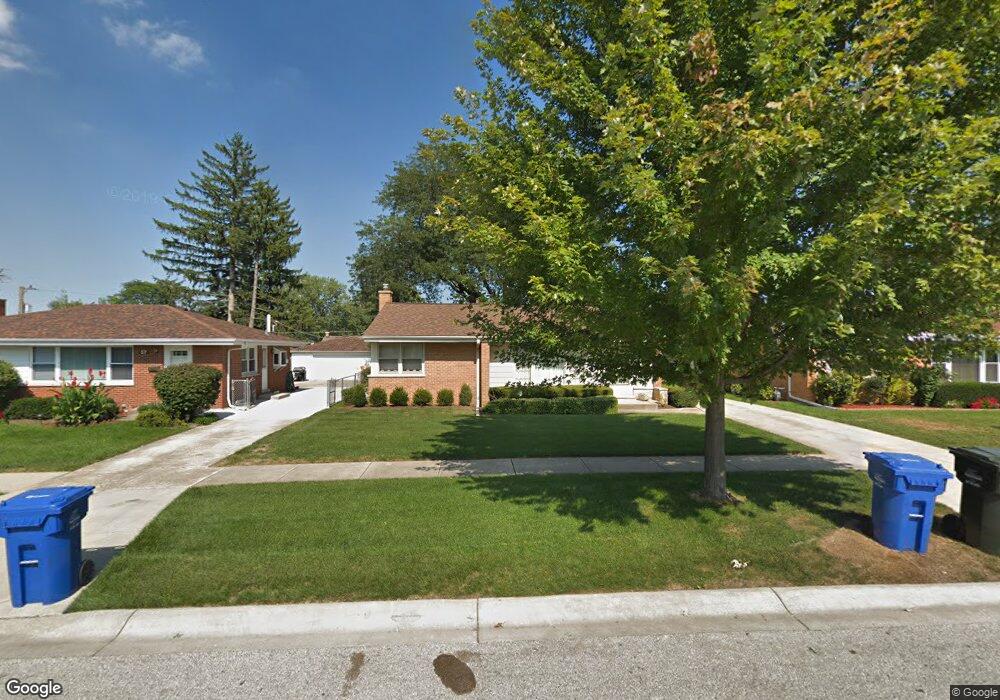
51 N Meyer Ct Des Plaines, IL 60016
Estimated Value: $391,000 - $493,000
4
Beds
3
Baths
1,526
Sq Ft
$286/Sq Ft
Est. Value
About This Home
This home is located at 51 N Meyer Ct, Des Plaines, IL 60016 and is currently estimated at $436,613, approximately $286 per square foot. 51 N Meyer Ct is a home located in Cook County with nearby schools including Terrace Elementary School, Chippewa Middle School, and Maine West High School.
Ownership History
Date
Name
Owned For
Owner Type
Purchase Details
Closed on
Nov 27, 2023
Sold by
Marie S Keenley Revocable Living Trust
Bought by
Mary Joyce Keenley Revocable Living Trust and Keenley
Current Estimated Value
Purchase Details
Closed on
Jan 18, 2021
Sold by
Keenley Marie S
Bought by
The Marie S Keenley Trust
Create a Home Valuation Report for This Property
The Home Valuation Report is an in-depth analysis detailing your home's value as well as a comparison with similar homes in the area
Home Values in the Area
Average Home Value in this Area
Purchase History
| Date | Buyer | Sale Price | Title Company |
|---|---|---|---|
| Mary Joyce Keenley Revocable Living Trust | -- | None Listed On Document | |
| The Marie S Keenley Trust | -- | Attorneys Ttl Guaranty Fund |
Source: Public Records
Tax History Compared to Growth
Tax History
| Year | Tax Paid | Tax Assessment Tax Assessment Total Assessment is a certain percentage of the fair market value that is determined by local assessors to be the total taxable value of land and additions on the property. | Land | Improvement |
|---|---|---|---|---|
| 2024 | $7,087 | $32,848 | $5,975 | $26,873 |
| 2023 | $9,263 | $36,000 | $5,975 | $30,025 |
| 2022 | $9,263 | $36,000 | $5,975 | $30,025 |
| 2021 | $7,186 | $23,379 | $4,920 | $18,459 |
| 2020 | $5,378 | $23,379 | $4,920 | $18,459 |
| 2019 | $5,408 | $26,269 | $4,920 | $21,349 |
| 2018 | $5,126 | $23,323 | $4,217 | $19,106 |
| 2017 | $4,698 | $23,323 | $4,217 | $19,106 |
| 2016 | $5,291 | $23,323 | $4,217 | $19,106 |
| 2015 | $5,412 | $22,399 | $3,690 | $18,709 |
| 2014 | $5,326 | $22,399 | $3,690 | $18,709 |
| 2013 | $5,949 | $25,123 | $3,690 | $21,433 |
Source: Public Records
Map
Nearby Homes
- 154 Cornell Ave
- 47 S Josephine Ct
- 304 Amherst Ave
- 633 S George St
- 332 S Cumberland Pkwy
- 316 S Mount Prospect Rd
- 220 E Washington St
- 52 N 6th Ave
- 214 S Mount Prospect Rd
- 758 Hanbury Dr Unit 66
- 760 Hanbury Dr Unit 65
- 39 N 5th Ave
- 407 E Berkshire Ln
- 21 W Bradley St
- 511 Bedford Ln
- 549 E Lincoln St Unit 549
- 500 S Owen St
- 450 Little Path Rd
- 224 W Bradley St
- 110 Westmere Rd
- 45 N Meyer Ct
- 57 N Meyer Ct
- 39 N Meyer Ct
- 63 N Meyer Ct
- 78 N Warrington Rd
- 72 N Warrington Rd
- 84 N Warrington Rd
- 66 N Warrington Rd
- 88 N Warrington Rd
- 33 N Meyer Ct
- 67 N Meyer Ct
- 60 N Warrington Rd
- 42 N Meyer Ct
- 36 N Meyer Ct
- 48 N Meyer Ct
- 92 N Warrington Rd
- 30 N Meyer Ct
- 71 N Meyer Ct
- 27 N Meyer Ct
- 54 N Warrington Rd