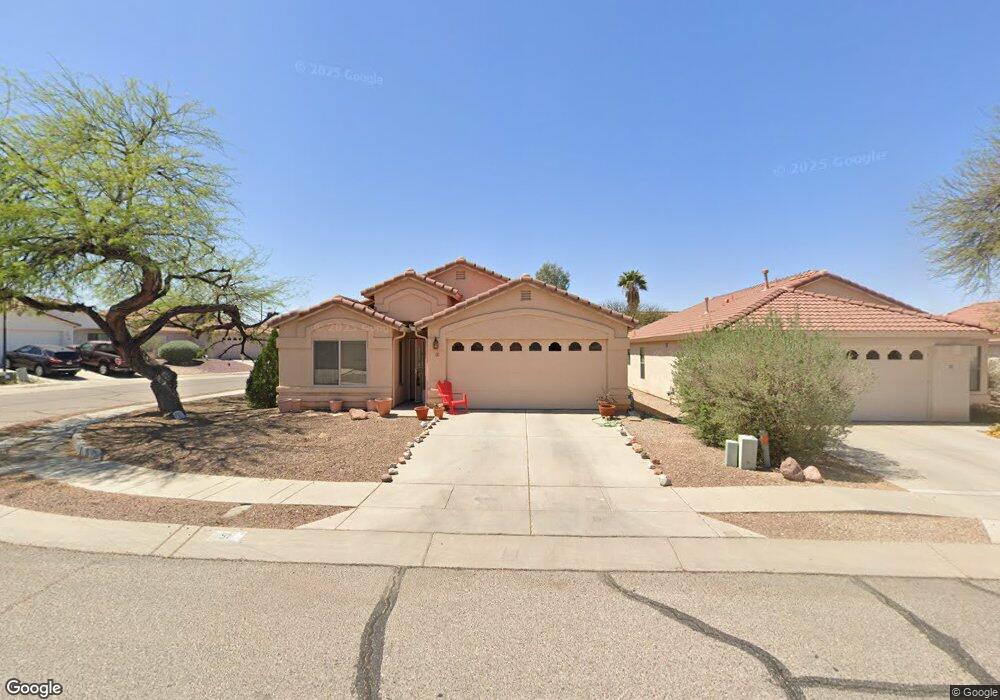
51 N Shadow Brook Place Tucson, AZ 85748
Eastside NeighborhoodEstimated Value: $318,000 - $363,000
--
Bed
2
Baths
1,630
Sq Ft
$207/Sq Ft
Est. Value
About This Home
This home is located at 51 N Shadow Brook Place, Tucson, AZ 85748 and is currently estimated at $337,832, approximately $207 per square foot. 51 N Shadow Brook Place is a home located in Pima County with nearby schools including Anna Henry Elementary School, Gridley Middle School, and Sahuaro High School.
Ownership History
Date
Name
Owned For
Owner Type
Purchase Details
Closed on
Nov 15, 2006
Sold by
Garcia Hortencia B
Bought by
Coolidge Cynthia E
Current Estimated Value
Home Financials for this Owner
Home Financials are based on the most recent Mortgage that was taken out on this home.
Original Mortgage
$180,000
Outstanding Balance
$106,890
Interest Rate
6.28%
Mortgage Type
New Conventional
Estimated Equity
$230,942
Purchase Details
Closed on
Feb 21, 2005
Sold by
Garcia Hortencia B
Bought by
Garcia Hortencia B
Purchase Details
Closed on
Sep 1, 2004
Sold by
Garcia Diana E
Bought by
Garcia Hortencia B
Purchase Details
Closed on
Aug 10, 2004
Sold by
Garcia Hortencia B
Bought by
Garcia Diana E
Purchase Details
Closed on
Jan 30, 2002
Sold by
Garcia Hortencia B
Bought by
Garcia Diana E and Garcia Hortencia B
Purchase Details
Closed on
Feb 25, 1998
Sold by
Title Security Agency Of Arizona
Bought by
Garcia Manuel J and Garcia Hortencia B
Home Financials for this Owner
Home Financials are based on the most recent Mortgage that was taken out on this home.
Original Mortgage
$100,000
Interest Rate
6.9%
Mortgage Type
New Conventional
Create a Home Valuation Report for This Property
The Home Valuation Report is an in-depth analysis detailing your home's value as well as a comparison with similar homes in the area
Home Values in the Area
Average Home Value in this Area
Purchase History
| Date | Buyer | Sale Price | Title Company |
|---|---|---|---|
| Coolidge Cynthia E | $241,000 | Longt | |
| Garcia Hortencia B | -- | -- | |
| Garcia Hortencia B | -- | -- | |
| Garcia Hortencia B | -- | -- | |
| Garcia Diana E | -- | -- | |
| Garcia Diana E | -- | -- | |
| Garcia Manuel J | $131,471 | -- |
Source: Public Records
Mortgage History
| Date | Status | Borrower | Loan Amount |
|---|---|---|---|
| Open | Coolidge Cynthia E | $180,000 | |
| Previous Owner | Garcia Manuel J | $100,000 |
Source: Public Records
Tax History Compared to Growth
Tax History
| Year | Tax Paid | Tax Assessment Tax Assessment Total Assessment is a certain percentage of the fair market value that is determined by local assessors to be the total taxable value of land and additions on the property. | Land | Improvement |
|---|---|---|---|---|
| 2025 | $2,653 | $23,749 | -- | -- |
| 2024 | $2,653 | $22,619 | -- | -- |
| 2023 | $2,506 | $21,541 | $0 | $0 |
| 2022 | $2,506 | $20,516 | $0 | $0 |
| 2021 | $2,556 | $18,915 | $0 | $0 |
| 2020 | $2,453 | $18,915 | $0 | $0 |
| 2019 | $2,383 | $18,539 | $0 | $0 |
| 2018 | $2,273 | $16,339 | $0 | $0 |
| 2017 | $2,169 | $16,339 | $0 | $0 |
| 2016 | $2,170 | $15,964 | $0 | $0 |
| 2015 | $2,075 | $15,204 | $0 | $0 |
Source: Public Records
Map
Nearby Homes
- 49 N Camino de La Reflexion
- 9735 E Shiloh St
- 9761 E Cinder Ct
- 9734 E Cannon Place
- 10161 E Queensgate Way
- 9716 E Hollow Place
- 360 S Marango Ln
- 10070 E English Woods Rd
- 10080 E English Woods Rd
- 9562 E Shiloh St
- 350 N Schrader Ln
- 411 S Marango Ln
- 250 S Sonoran Heights Dr
- 506 N Banff Ave
- 9520 E Evita Ln
- 10520 E Blue Marble St
- 10338 E Red Slate Place
- Finch Plan at Houghton Reserve - Esplanade
- Vineyard Plan at Houghton Reserve - Alameda
- Dove Plan at Houghton Reserve - Esplanade
- 63 N Shadow Brook Place
- 9885 E Shadow Glen Ct
- 75 N Shadow Brook Place
- 9920 E Shadow Glen Ct
- 9914 E Shadow Glen Ct
- 9908 E Shadow Glen Ct
- 9879 E Shadow Glen Ct
- 50 N Shadow Brook Place
- 87 N Shadow Brook Place
- 38 N Shadow Brook Place
- 62 N Shadow Brook Place
- 9902 E Shadow Glen Ct
- 26 N Shadow Brook Place
- 74 N Shadow Brook Place
- 9873 E Shadow Glen Ct
- 9873 E Shadow Glen Ct
- 9896 E Shadow Glen Ct
- 9890 E Shadow Glen Ct
- 14 N Shadow Brook Place
- 86 N Shadow Brook Place