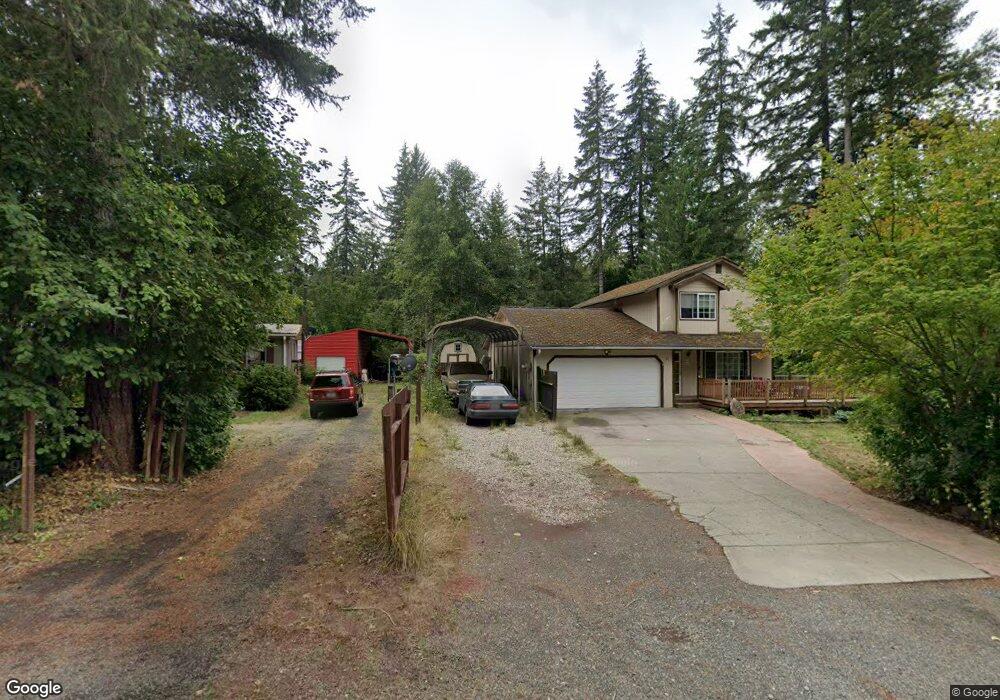
51 NE Snowcap Dr Tahuya, WA 98588
Estimated Value: $321,000 - $543,000
3
Beds
3
Baths
1,246
Sq Ft
$343/Sq Ft
Est. Value
About This Home
This home is located at 51 NE Snowcap Dr, Tahuya, WA 98588 and is currently estimated at $427,783, approximately $343 per square foot. 51 NE Snowcap Dr is a home located in Mason County with nearby schools including North Mason Senior High School.
Ownership History
Date
Name
Owned For
Owner Type
Purchase Details
Closed on
Jul 30, 2018
Sold by
Griese Nichole
Bought by
Mccracken Erin
Current Estimated Value
Home Financials for this Owner
Home Financials are based on the most recent Mortgage that was taken out on this home.
Original Mortgage
$6,720
Outstanding Balance
$5,849
Interest Rate
4.6%
Mortgage Type
Purchase Money Mortgage
Estimated Equity
$421,934
Purchase Details
Closed on
Oct 5, 2011
Sold by
Reardon Deanna G
Bought by
Griese Nichole
Home Financials for this Owner
Home Financials are based on the most recent Mortgage that was taken out on this home.
Original Mortgage
$123,316
Interest Rate
4.16%
Mortgage Type
New Conventional
Purchase Details
Closed on
Oct 4, 2011
Sold by
Griese Thomas Charles and Griese Nichole
Bought by
Griese Nichole and Griese Thomas Charlses
Home Financials for this Owner
Home Financials are based on the most recent Mortgage that was taken out on this home.
Original Mortgage
$123,316
Interest Rate
4.16%
Mortgage Type
New Conventional
Create a Home Valuation Report for This Property
The Home Valuation Report is an in-depth analysis detailing your home's value as well as a comparison with similar homes in the area
Home Values in the Area
Average Home Value in this Area
Purchase History
| Date | Buyer | Sale Price | Title Company |
|---|---|---|---|
| Mccracken Erin | $180,281 | Olympic Title Company | |
| Griese Nichole | $119,280,898 | First American Title | |
| Griese Nichole | -- | First American Title |
Source: Public Records
Mortgage History
| Date | Status | Borrower | Loan Amount |
|---|---|---|---|
| Open | Mccracken Erin | $6,720 | |
| Previous Owner | Griese Nichole | $123,316 |
Source: Public Records
Tax History Compared to Growth
Tax History
| Year | Tax Paid | Tax Assessment Tax Assessment Total Assessment is a certain percentage of the fair market value that is determined by local assessors to be the total taxable value of land and additions on the property. | Land | Improvement |
|---|---|---|---|---|
| 2025 | $2,245 | $311,265 | $24,415 | $286,850 |
| 2023 | $2,245 | $303,920 | $23,250 | $280,670 |
| 2022 | $2,247 | $249,575 | $24,475 | $225,100 |
| 2021 | $2,106 | $249,575 | $24,475 | $225,100 |
| 2020 | $2,383 | $239,635 | $15,775 | $223,860 |
| 2018 | $1,935 | $168,975 | $16,535 | $152,440 |
| 2017 | $1,793 | $169,050 | $16,610 | $152,440 |
| 2016 | $1,694 | $160,370 | $16,610 | $143,760 |
| 2015 | $2,027 | $152,715 | $16,610 | $136,105 |
| 2014 | -- | $180,075 | $29,700 | $150,375 |
| 2013 | -- | $180,075 | $29,700 | $150,375 |
Source: Public Records
Map
Nearby Homes
- 2020 NE Tahuya River Dr
- 147 NE Snowcap Dr
- 0 Cheyenne Hill Dr
- 621 NE Beitzel Dr
- 0 XXXX NE Beitzel Dr
- 961 NE Snowcap Dr
- 110 NE Collins Dr E
- 291 NE Collins Lake Dr
- 0 lot 10 NE Lake View Place
- 41 NE Creekview Place
- 230 NE Hilltop Place
- 7150 NE North Shore Rd
- 200 NE Tee Lake Pines Rd
- 0 NE North Shore Rd Unit NWM2375952
- 0 NE North Shore Rd Unit NWM2347029
- 371 NE Tee Lake Rd
- 621 NE Tee Lake Rd
- 30 NE Lake Dr
- 1173 NE Hurd Rd
- 1571 NE Bear Ridge Rd
- 1810 NE Tahuya River Dr
- 53 NE Snowcap Dr
- 81 NE Snowcap Dr
- 1780 NE Tahuya River Dr
- 61 NE Snowcap Dr
- 111 NE Snowcap Dr
- 57 NE Snowcap Dr
- 1801 NE Tahuya River Dr
- 1900 NE Tahuya River Dr
- 1781 NE Tahuya River Dr
- 141 NE Snowcap Dr
- 110 NE Snowcap Dr
- 1920 NE Tahuya River Dr
- 1910 NE Tahuya River Dr
- 1831 NE Tahuya River Dr
- 1741 1761 NE Tahuya River Dr
- 1861 NE Tahuya River Dr
- 0 NE Waterhill Rd
- 31 NE Rainbow Place
- 180 NE Snowcap Dr