Estimated Value: $309,859 - $410,000
4
Beds
2
Baths
1,588
Sq Ft
$238/Sq Ft
Est. Value
About This Home
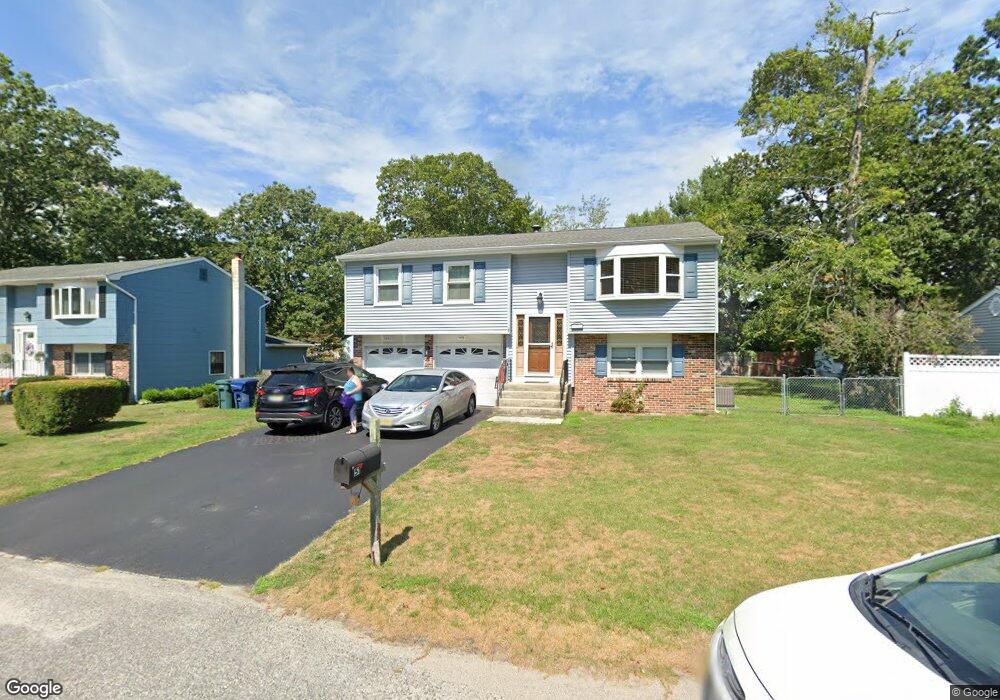
This home is located at 51 Oakleaf Dr, Little Egg Harbor Township, NJ 08087 and is currently estimated at $378,715, approximately $238 per square foot. 51 Oakleaf Dr is a home located in Ocean County with nearby schools including Frog Pond Elementary School, Pinelands Regional Junior High School, and Pinelands Regional High School.
Ownership History
Date
Name
Owned For
Owner Type
Purchase Details
Closed on
Jul 29, 2002
Sold by
Searles Mary Ann
Bought by
Honey Patrick J and Honey Sandra
Current Estimated Value
Home Financials for this Owner
Home Financials are based on the most recent Mortgage that was taken out on this home.
Original Mortgage
$139,050
Outstanding Balance
$58,965
Interest Rate
6.58%
Mortgage Type
VA
Estimated Equity
$319,750
Purchase Details
Closed on
Feb 3, 1994
Sold by
Citicorp Mtg
Bought by
Demeter Steven and Demeter Mary
Create a Home Valuation Report for This Property
The Home Valuation Report is an in-depth analysis detailing your home's value as well as a comparison with similar homes in the area
Home Values in the Area
Average Home Value in this Area
Purchase History
| Date | Buyer | Sale Price | Title Company |
|---|---|---|---|
| Honey Patrick J | $135,000 | -- | |
| Demeter Steven | $20,000 | -- |
Source: Public Records
Mortgage History
| Date | Status | Borrower | Loan Amount |
|---|---|---|---|
| Open | Honey Patrick J | $139,050 |
Source: Public Records
Tax History Compared to Growth
Tax History
| Year | Tax Paid | Tax Assessment Tax Assessment Total Assessment is a certain percentage of the fair market value that is determined by local assessors to be the total taxable value of land and additions on the property. | Land | Improvement |
|---|---|---|---|---|
| 2025 | $4,628 | $156,200 | $58,100 | $98,100 |
| 2024 | $4,435 | $156,200 | $58,100 | $98,100 |
| 2023 | $4,249 | $154,500 | $58,100 | $96,400 |
| 2022 | $4,249 | $154,500 | $58,100 | $96,400 |
| 2021 | $4,148 | $154,500 | $58,100 | $96,400 |
| 2020 | $4,094 | $154,500 | $58,100 | $96,400 |
| 2019 | $3,888 | $152,900 | $58,100 | $94,800 |
| 2018 | $3,667 | $152,900 | $58,100 | $94,800 |
| 2017 | $3,603 | $152,600 | $58,100 | $94,500 |
| 2016 | $3,632 | $152,600 | $58,100 | $94,500 |
| 2015 | $3,676 | $152,600 | $58,100 | $94,500 |
| 2014 | $4,359 | $228,100 | $107,000 | $121,100 |
Source: Public Records
Map
Nearby Homes